Blog_Machine_Learning_Premier_League

PREMIER LEAGUE - ON MACHINE LEARNING

PREMIER LEAGUE - ON MACHINE LEARNING
by Ditty April 2018
Keywords: Machine Learning, Premier League, Poisson distribution, Generalized Linear Models, Supervised Learning
Introduction - What is going on 
With my brother and his son being avid supporters of Arsenal and having endless discussion on who will finish at the top of the table by the end of the season - I was interested if machine learning could help answer this question. What always seems to amaze me is the familiarity of statistics by my nephew. Ask for a match statistic and chances are he'll probably be able to answer it. In general I think that the amount of data collected on matches has increased at an absurd rate compared to eighties / early nineties - when I grew up with football. And yes to get that discussion out of the way, the proper name for this lovely game is football. Not soccer. 
Objective & Limitations
In this research I will try to create a machine learning algorithm to try and predict the outcome of matches. Hence we will use the data for the seasons 2016 - 2017. All with the objective to make pre-match fun (and endless discussion) more fun..
Research Question - what to better understand
Making our objective and limitations more concrete the following research question is defined?

How can Machine Learning help to predict outcome of matches in the English Premier League?
In order to help answer this question I will be using R studio. This is an open scource software program mainly designed for statistical computing. You can find out more about Rstudio here.
Data Collection
The data that I used in this project are collected from github, www.premierleague.com and  Kaggle

The analysis set consisted of two datasets:

  1. Results
  2. Match Statistics 
Results (as taken from Kaggle)
Results of 4560 Premier League matches - 380 matches over 12 seasons from 2006/2007 to 2017/2018.


Match Statistics (as taken from Kaggle)
The stats can be categorised as follows:

General 
column 1-5 (start counting from 0) 
wins, losses, goals, yellow cards, red cards

Attack 
column 6-15 
shots, shots on target, hit woodwork, goals from header, goals from penalty, goals from free kick, goals from inside box, goals from outside box, goals from counter attack, offsides

Defence 
column 16-28 
clean sheets, goals conceded, saves, blocks, interceptions, tackles, last man tackles, clearances, headed clearances, own goals, penalties conceded, goals conceded from penalty

Team Play 
column 29-34 
passes, through balls, long passes, backwards passes, crosses, corners taken

Others 
column 35-42 
touches, big chances missed, clearances off line, dispossessed, penalties saved, high claims, punches, season
Data Manipulation
During this phase of the analysis we will focus on constructing our analysis set for our research. Here we need to combine the two data sets and create the same level of analysis. Hence from the Results data we are able to calculate the total season points and for the Match Statistics data we can aggregate the data from every match to the level of a team. Meaning that we now have transformed our data to the same level of analysis, namely on team level. 

Just to give you an impression the image below shows how the top 6 best performing clubs looked and the 6 worst performing teams looked. As presented by the fishy.co.uk
Analysis
Now that we have created our analysis set, we can have a closer look at the variables in our set. In particular we are interested in the distribution of these variables and also how they relate to each other. 

The figure below shows how the season end point are distributed. Where, without actually plotting a normal distribution into the plot, it might be safe to say this is no signs of normality here.
After having investigated the season end points it might be interesting to further investigate the match statistics in terms of goals scored - to see if we can identify patterns.
Poisson distribution
The interesting pattern that we see in the distribution images above give hints towards a Poisson distribution.Without going into the full mathematical theory behind the distribution let's try to plot the assumptions behind the distribution on a game of football. 

Would you say that in theory that a goal could be scored at any moment? I would say yes. And those moments should fall between the first seconde and the last seconde of the match? Yes, goals scored before or after the game don't count. And, are goals independent from each other? I would (in theory) also answer positive to this one, as in theory any team is able to score a goal independently from previous goals. Now comes the fun part these are also the main assumptions of a Poisson distribution. Namely, events (goals) happen within a certain time (and or space) and events occur independently from each other.

When working with Poisson distribution within the the context of football matches, we can calculate some interesting metrics that can help us predict the outcome of fixtures - under the conditions of a Poisson distribution. From that perspective let's zoom in on the team results and try to find out what every team on average does. It will be the rationale for modelling the logarithm of the mean as a linear function, where the result will be a generalised linear model with Poisson distribution. More on that not in de following sections.
The images above gives us a better understanding on what on 'average' home and away games might look like. If you're looking for your hometeam to (at lease) score 2 goals on average per game, chances are that Arsenal, Liverpool, Man City, Man United and Tottenham are your best bets. If you travel along with your club and what to see your club score more than once Chelsea, Leister, Liverpool, Man City, Man United and Tottenham are probably the best to support. 

From the averages presented above, in a very simplified model we could be able to simulate a match. Let's say Arsenal (home) against Liverpool (away). From our Arsenal home average would could conclude that they are most likely to score 2 or 3 goals. Where Liverpool based on their mean scored away goals are probably going to score 2 goals. Let's check what the premier league website had to say on this.
So, we we were right on the amount of home goals produced by Arsenal, however we were quite off with the amount of goals Liverpool was able to produce. 

Form a statistical perspective we need to enhance our 'mean comparison' approach and statistically start simulating matches in order to check what the possibilities are for specific outcome of fixtures. E.g. based on the Poission distribution we can use Generalised Linear Models to estimate these outcomes
Generalised Linear Model
Based on the Generalised Linear Model Equation. In this model the dependent variable is the amount of goals scored (by each team) and the independent variables are home(team), away(team) and home/away match. 

Without going into too much detail below you can find some of the model output. In the image below we we can see the statistical strength of the found relation of the independent variables. And also that there is a statistical positive home advantage. (home = 0.28883)
Back to Arsenal vs Liverpool
Based on the model that we built we are able to predict the amount of goals, where we have to give in the parameters if it is a home or away match and obviously who they're playing against. For the opponent we will need to do the same and consequently we will have have calculated an expected match outcome. After passing these metrics trough the model. The model predicted the following outcome. Which unfortunately was not the case!
Conclusion
In this research we investigated if we could predict outcomes of premier league fixtures. Here we showed that closely related to such research the Poisson distribution plays an import role when predicting the fixture outcome. One of the key assumptions being that events (in our case goals) occur in a certain time and are independent of each other. To translate this into a model we started by investigating how team averages looked for home and away matches. From there we wanted to create a more robust model. So we could theoretically run simulations and evaluate the occurrence of different outcomes. Hence, this model gives us the probability of specific match outcomes. 

Unfortunately our findings show that there are more variables that determine match outcome than our simple Generalised Linear Model handels. 

Nonetheless applying statistics to a lovely game of football does provide the necessary input for pre-match fun time with your familie or mates! 
Future research
In terms of techniques in this research we only used Generalised Linear Models where with log transformation and few variables relativity an easy model can be created. However for more precise estimation it might be a good idea to add different variables to a model such as teambudgets or player characteristics. 

For now - I to some extent also enjoy the unpredictability of the game!
Hope you enjoyed reading! 

All the best,

Ditty

Ditty Menon, The Data Artists, Ditty

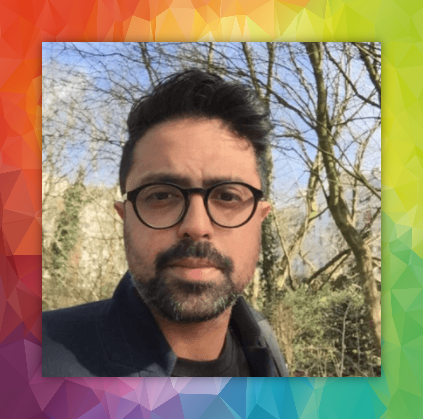
About the Author: Ditty Menon

Founder of The Data Artists, The Data Artists Music and Nederland Wordt Duurzaam


Erasmus University Rotterdam Alumni with 12 years of experience in Data Science / Analytics / Digital. Passionate about incorparating data into all aspects of life & (more recent) using data for a sustainable world.


Radom facts:

Starts his day with a flat white or caffe latte and the financial times podcast.

Broke his glasses when walking into a lamppost while thinking of a coding issue

Loves Serendipity

Share by: