Blog_Iinauguratio_compairing_US_leaders

INAUGURATION - COMPARING OBAMA/TRUMP

INAUGURATION - COMPARING NOTES OF OBAMA AND TRUMP
by Ditty April 2017 
Keywords: Supervised Machine Learning, Unsupervised Machine Learning, Natural Language Processing, NLP, Text mining, US.
Introduction - What is going on 
In 2016 I did a small machine learning research where with the use of unsupervised learning it tried to create a topic model algorithm on the lyrics of David Bowie's Blackstar album. Initially I wanted use unsupervised machine learning, however I found that working with lyrics the human aspect is an import part of bringing across the performer's views or feeling. Therefor I had to perform some interpretation on the lyrics before feeding them trough the algorithms. Implying that I was now supervising the machine, and no longer let the machine make all it's choices by it's self. 

The reason why I started investigating the Blackstar album, was because at the time of the release of the album. David Bowie had just passed away and a lot popular media were talking about the fact that while recording the album he was already making references to his passing. Thus, I wanted to find out if machine learning algorithms used in Natural Language Processing could detect and support such claims. Unfortunately my endeavours didn't provide the results that I hoped for, as I found no statistical support for such claims. "Computer said NO!" However I suspect that looking at different angles at the lyrics might have provided better insights. 

For this research I wanted to perform a similar analysis where I would now depict the inauguration speeches of US leaders Barack Obama and Donald Trump, in order to find statistical support that based on their first words as president of the country key differences could be found and giving insights towards their administration' s direction.

Managerial Implication 

In the current Data Science field a lot definitions are hyped and interchangable. Artifical Intelliige, Machine Learning (supervisied & unsupervised) and Deeplearning. 

Although not extensive here are some insights to help you have a better understanding about the differences. Note that these are just defnitions I found online, that hopefully clarifiy how the concepts relate to each other.

Artificial Intelligence: 
Artificial Intelligence can be seen as a broad(er) area of research where algorithms enable computerised (artificial) learning.  A classification in Artificial Intelligence can be made based on the capabilities of the Artificial Intelligence. In literature the following categories within Artificial Intelligence can be identified.

  1. Artificial narrow intelligence (ANI) consisting of narrow range of abilities;
  2. Artificial general intelligence (AGI), comparable with human capabilities; 
  3. Artificial super-intelligence (ASI), surpasses human capability than a human
Machine Leaning:
As pointed out by Anish Talwar and Yogesh Kumar in their paper: Computer ScienceMachine Learning: An artificial intelligence methodology in Computer Science (2013) - scientists introduced Machine Learning as a concept within the domain Artificial Intelligence. In this concept machines are taught to detect different patterns and to adapt to new circumstances.

Deep Learning;
Deep Learning is a subset of Machine Learning techniques and as pointed out by Michael Copeland in: What’s the Difference Between Artificial Intelligence, Machine Learning and Deep Learning, 2016) Deep Learning can be seen as "the next evolution of Machine Learning".Where with Deep Learning  it is possible to automatically discover features,  and Machine Learning requires that these features to be provided manually.

Concluding: Deep Learning can be seen as a method used in Machine Learning. Where Machine Learning is part of a broader research area Artificial Intelligence. 

Objective & Limitations - Keep it small gradually increase knowledge
As mentioned in the introduction, in this research we will be having a closer look at the inauguration speeches of Barack Obama (2007) and Donald Trump. In particular we are set out to find if there is statistical support in finding key differences in both speeches. There, we would expect the content of the speeches to differ, closely related to different media images of both leaders. 

From a statistical (data science) perspective, computerised text analysis has always been of particular interest to me, as the concepts of classifying words and sentences into numbers and then finding statistical relations between those components, fascinates me! As we may be able to discovering larger beliefs from what people say. 

With this computerised approach towards text analysis, also comes a complexity / limitation, in terms of modelling for meaning for human factors such as a humour or sarcasm. There were we in 'real life' situations we might mean the opposite of what we say - the computer will be less likely to detect this. 
Research Question - what to better understand
In this posts I will be zooming in on the following research questions:
  1. How do the inauguration speeches of Barack Obama and Donald Trump differ?

With the use of R (language and environment for statistical computing and graphics) I will be using data science technique and methods related to computerised text analysis. like Latent Dirichlet Allocation (LDA) or (Visual) Topic Modelling. These insights will help us statistically finding differences in both speeches.

Managerial Implication 

Now that you are fully aware of the key differences of Artificial Intelligence (AI), Machine Learning (MA) and Deep Learning (DL) and can place them in the context of Computerised Text Analysis, it's important have some understanding about the statistical and language concepts behind it.

Topic modeling (TM)
Topic modelling is a set of techniques for automatically organising, understanding, searching, and summarising large amounts of texts. It can help with the following challenges:

  1. Identifying clusters of what is being said
  2. allocating new input to those clusters

Latent Dirichlet Allocation (LDA)
Within Topic Modelling, Latent Dirichlet Allocation (LDA) is an important concept. To help you in discussion with data scientists, I'll provide you with a simplified overview. Hopefully resulting in greater knowledge about key concepts. 

Conceptually LDA is a technique where we transform plain text into data table. Here by counting the occurrence of different words in the text and allocating them to a topic (cluster) - we will be able to calculate a probability for each word that it is related to that topic. 

An example here could be if we would feed the LDA algorithm emails between a manager an a data scientist it would be thinkable that we could detect different Idiolects (set of words and intonation typical to an individual) between the two functions. Solely for clarification purposes I'm labelling the manager as result driven and the data scientist as technique driven. Hence words as timing, costs or deliverables would (cor)relate to a cluster that we could label "management" and words as model, hypothesis and statistics support would (cor)relate to a cluster that we could label "technique". Interestingly we would also be able to discover which are less related to one person when we have 'chit-chat' in our emails with words weather, family or weekend we could label that as 'informal chats'. The latter type of classification is form the perspective of text analysis more interesting as solely performing a machine learning endeavour to find topic of mangers vs those of data scientist mighty not be worth the effort. As we're aiming to find the underlying topics, not the persons.

As the mathematical concepts are quite complex behind LDA, I'll provide you with the key steps in process.

  1. Set the number of clusters / topic we want to find. (can be calculated statistically or hypothesis based)
  2. Calculate word, topic correlation (based on Dirichlet distributions)
  3. Calculate topic, document correlation (based on Dirichlet distributions)
  4. Re-iterate to re-calculate word, topic correlation (based on Dirichlet distributions)
Where it is first done randomly in a simplified manner to set a benchmark and test set for the final part to score the model output. This is somewhat oversimplification of the statistical part, nevertheless I hope it gives insights on how the process works.
Let's get staRted - Data collection & Manipulation
In order to perform the analysis I found the text versions of Obama's and Tump's speech online. Where I manually created text files to load into my R Studio environment.

For this analysis we will use the principles of tidy data. This is a standardised way of storing and handling your data. Resulting in a standardised way of working for data science initiatives. As this way of working makes it easier to work with a lot of different R packages, as these packages are based on the same principles in terms of how the expect input-data needs to be configured. 

You can find more detailed explanation of the Tidy data framework in my previous post where the importance for robust and reproduce data science initiatives are also discussed. 
Data Handling
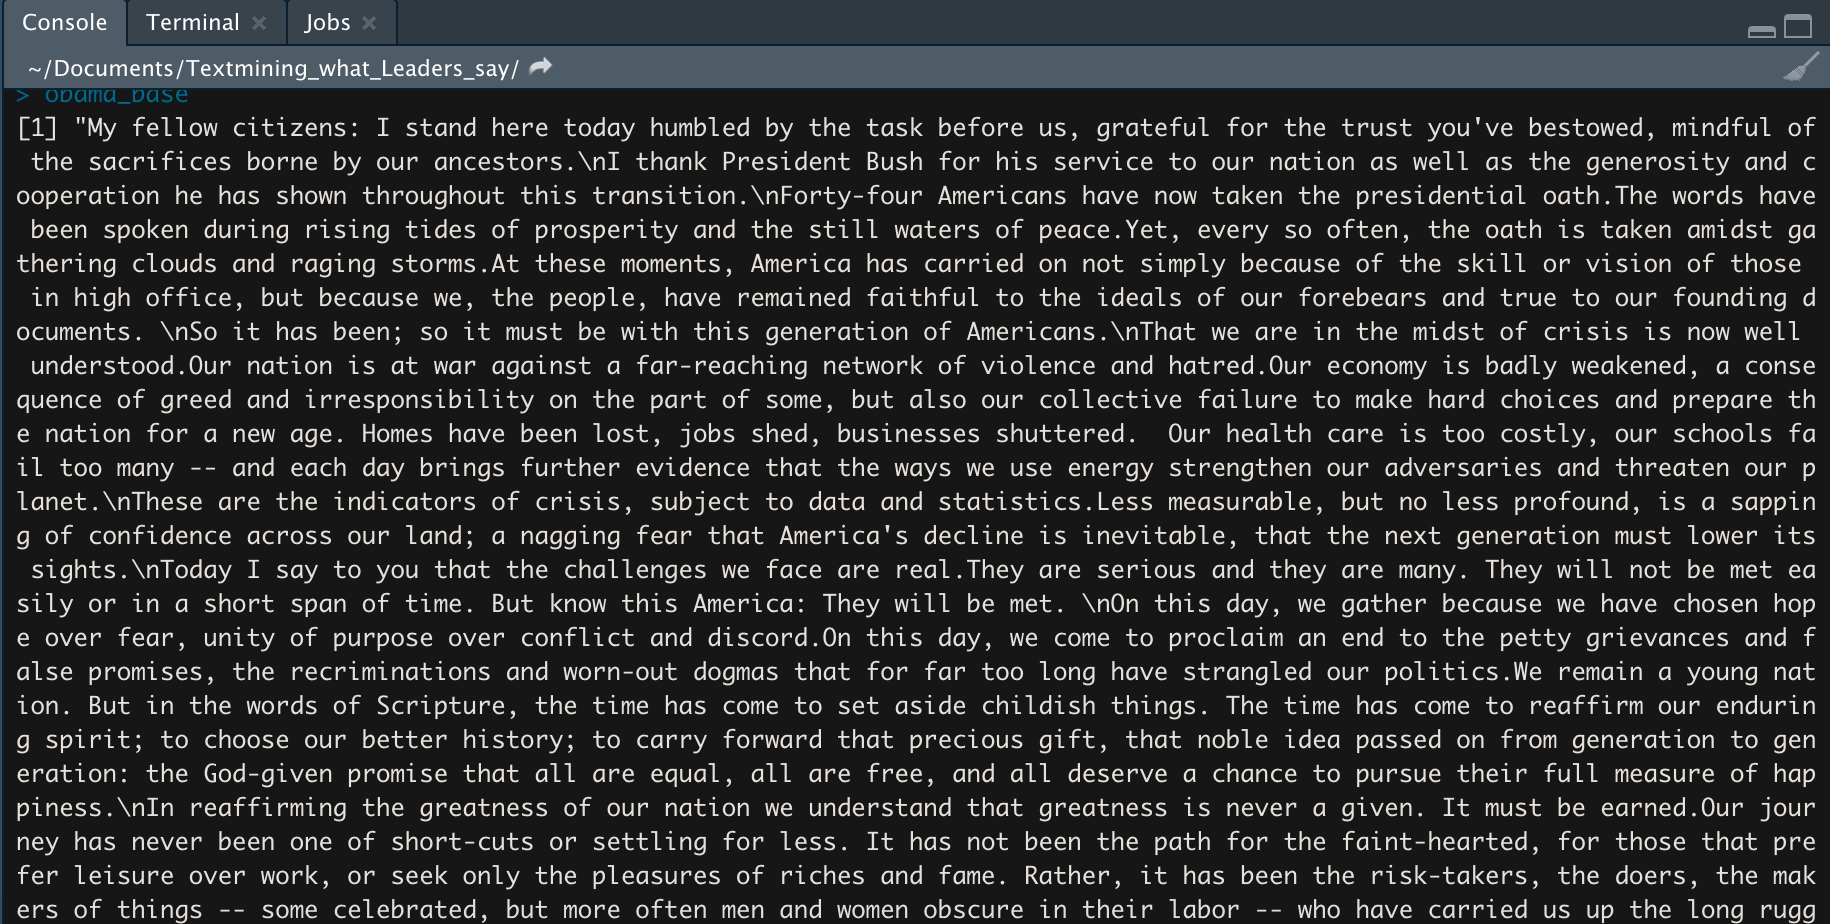
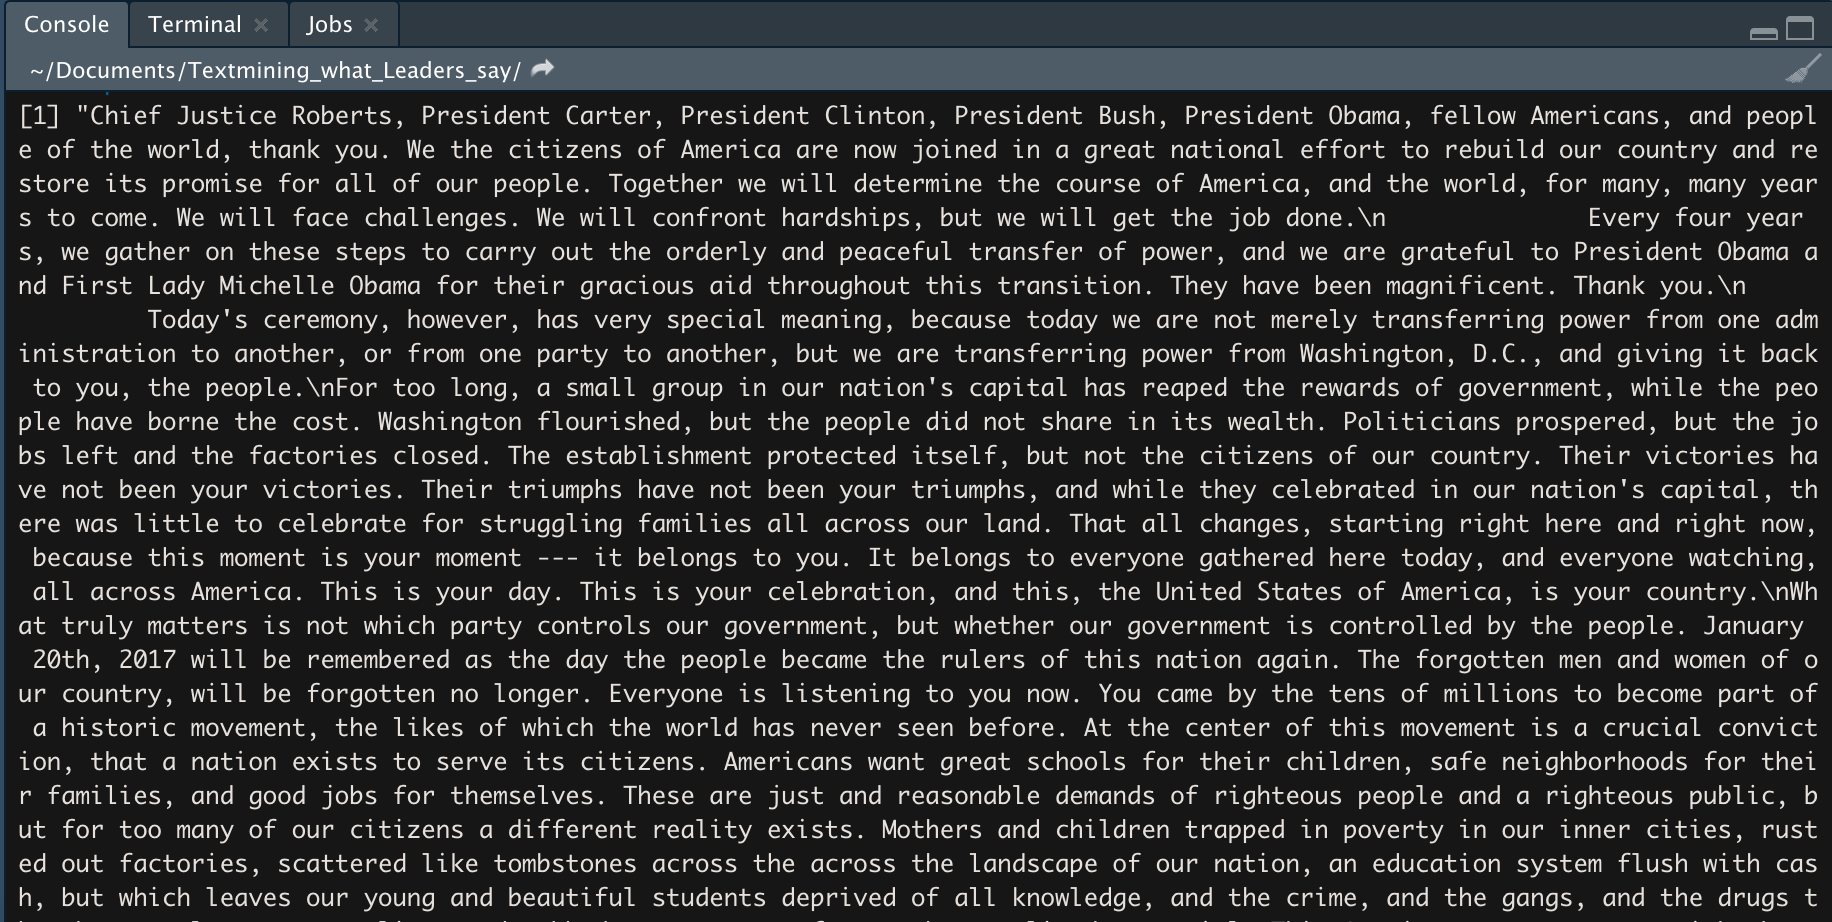
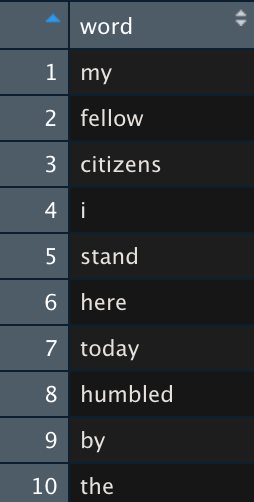
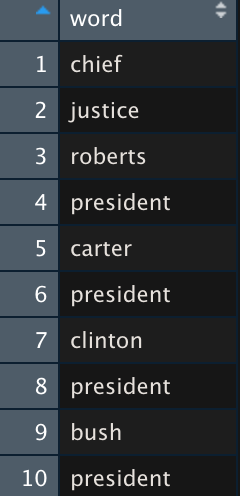
Note that we have loaded both speeches into our R environment is the first step in our data handling process and will now transform the speech into individual words. This process is called tokenisation (of the plain texts). The images below show the input data and the tokenised versions of that same plain text. Simultaneously we also remove stopwords (words that don't represent meaning). Typically, these are words such as “the”, “of”, “to”, etc.
Analysis
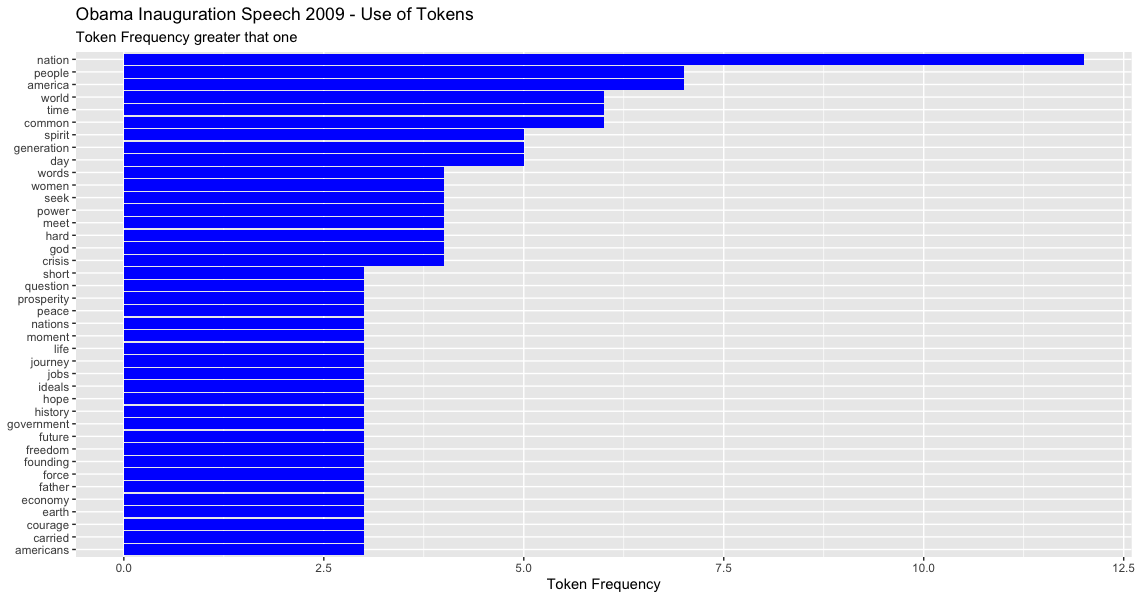
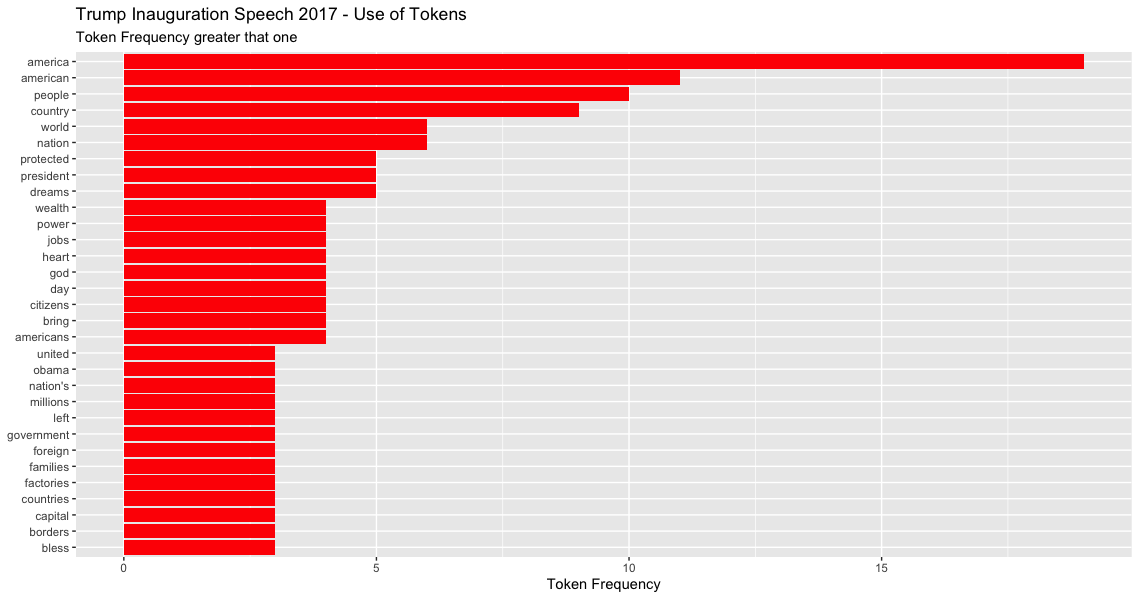
Now that all the data is available in out R environment and the words without meaning have been remove. we can start by visualising the data. Let's start with creating a histogram of the the most used tokens by both presidents. 

For this analysis we look at tokes that are used more than once. This is in our case somewhat arbitrary. For relatively short speeches this may be useful for initial investigation. The first graph shows Obama's most used tokens and the second one illustrates Tump's token use. Please note that both graphs have different x-as scaling.
Now that we have a some insights towards which words both leaders use, it might be interesting to further investigate the words both leaders use vs. those which are specific for either Obama of Trump. In order to do this the used tokens can be classified into three categories:
  1. Obama Only
  2. Trump Only
  3. Obama and Trump
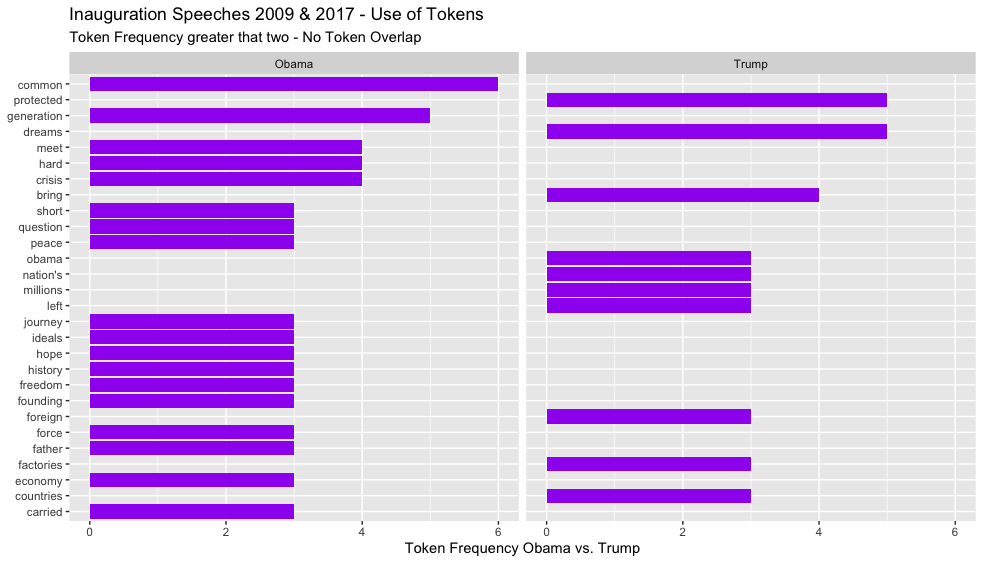
Sole usage per president (Obama Only and Trump Only - Group 1 & 2)
Here we want to zoom in on the tokens both presidents used during their inauguration speech. The aim here is to identify different 'accents' that both leaders would like to bring across during their inauguration. Based on the low occurrence (repeating of words) of words it is difficult to draw hard conclusions the plots below. It does give some insights where speeches differ.
Obama and Trump
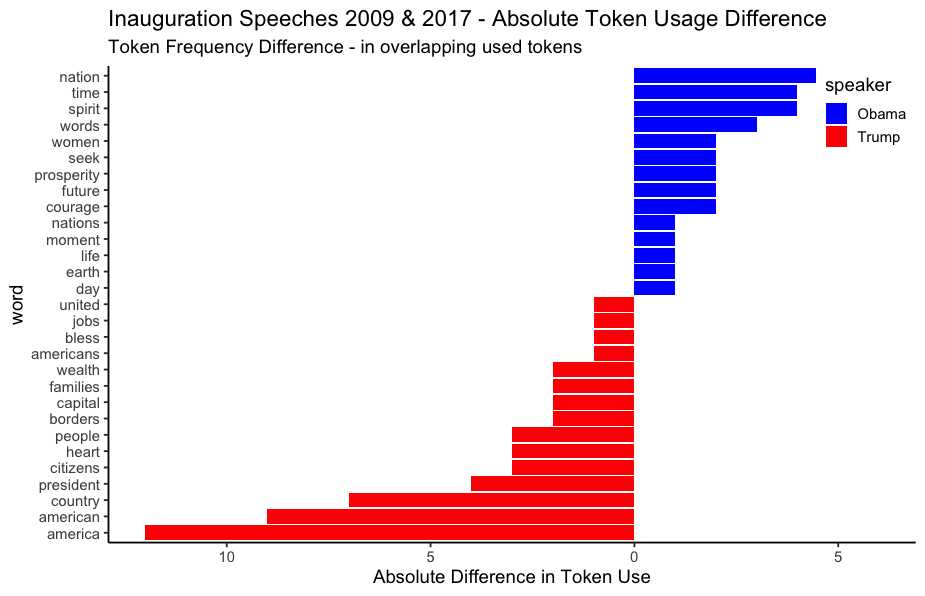
In the previous section we tried to find key differences by exclusion of commonalities in tokens - between both speakers. In this section we will have a closer look at the common ground of both speeches and investigate the 'power' of this differences. E.g. if one speaker is more vocal than the other on a certain topic.  

Therefore within the group of similar used tokens we can calculate the difference between speakers. In the figure below we can see that the bars of president Trump have a greater reach than those of President Obama. Implying that for these tokens President Trump is more vocal, by repetition of these words. 

Furthermore interesting to see is that for the items that President Obama can be seen as more vocal by repetition the relative distance towards how many times president Trump used a token has a smaller reach than in the opposite case. When president Trump is categorised as being more vocal. Implying that president Trump focusses on repeating one message. Which intuitively makes some sense, when placed into the context of fairly simple messages as: "build a wall" and "make America great again". 
Sentiment Analysis
Now that we have gained some insights towards what words both speakers have used in their speech, let see if we investigate if we can find sentiments in their speeches. Here we use different available lexicons to cross check the used words for corresponding sentiments. 

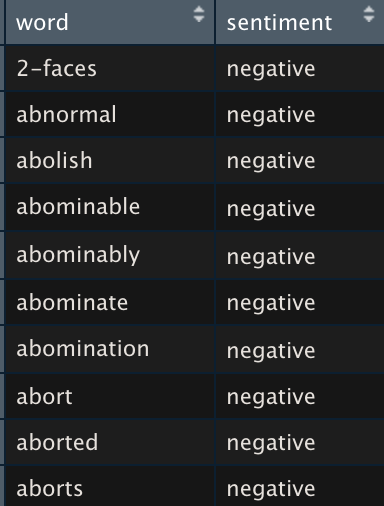
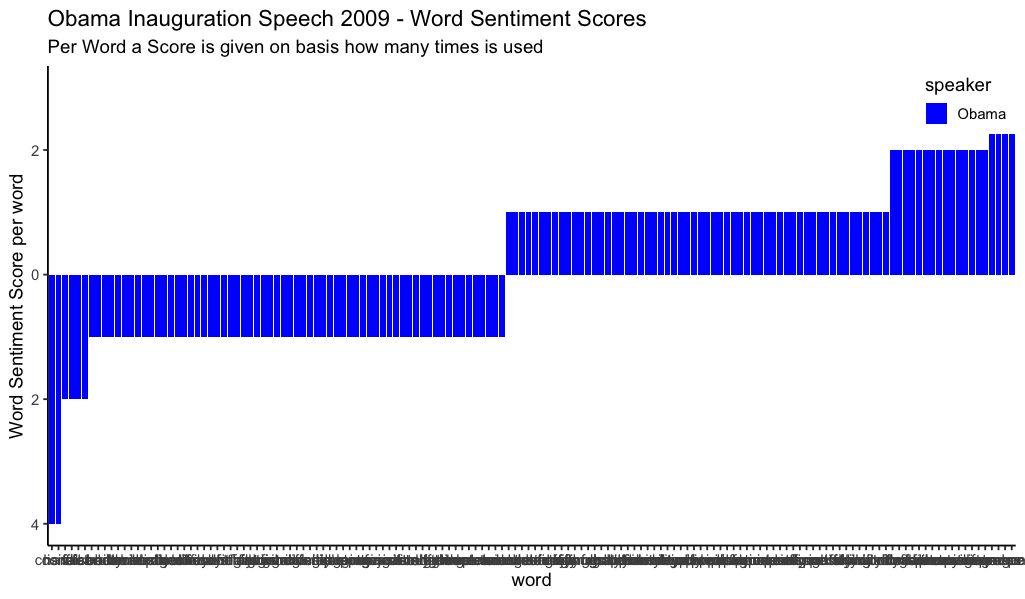
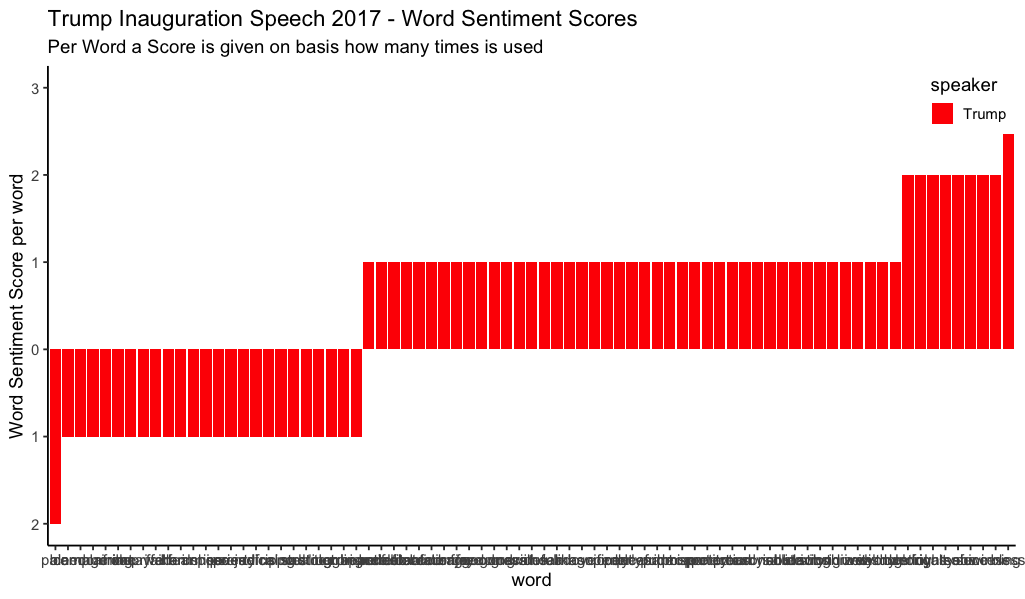
In our case we will use the 'Bing' Lexicon.(University of Illinois at Chicago (UIC) ,Department of Computer Science 2011). In this lexicon English words are categorised into positive and negative sentiments. This list is comprehensive, and also takes into account that not all words may have a direct positive or negative sentiment related to it. Below you can see an example of the 'Bing' Lexicon. And what the results look like when compared against both speeches. Interesting to see when comparing both speakers is, that the right tail in president Trump's speech seems to have a longer tail than when compared to the right tail of Obama's speech. Implying that President Trump is more vocal in bringing across the emotion.

Furthermore the depth of each tokens provides us hints towards a certain intensity of that given sentiment. What is noticeable here, is that Obama's figure shows more (downward)depth on the left tail (negatively ranked tokens) and more (upward)depth in the right tail -when compared to Trump's speech. Implying that Trump's speech consists of more positive elements than negative, and showing slightly more intensity of those positive elements. Where Obama's speech shows a more balance in the use of positive and negative evaluated tokens. With an outlier in negatively ranked token and the amount of times it is used in the speech. 
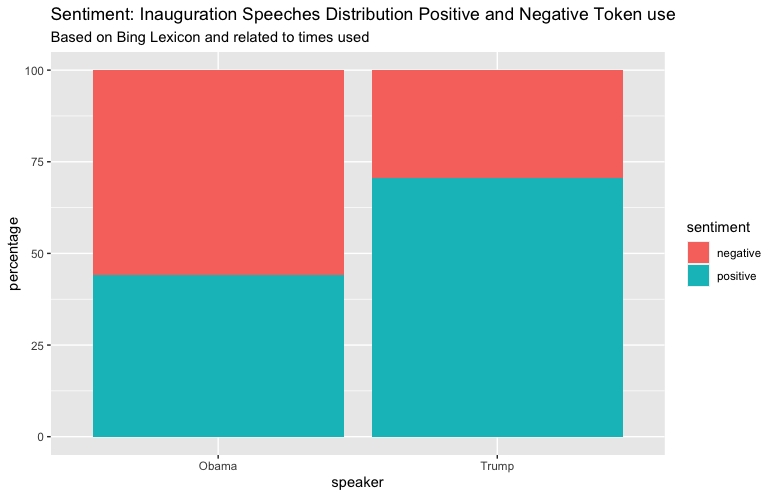
If we compare the sentiments of both speakers we find the following percentages for Obama's speech: 44.13% positives and 55.87% negatives. For Trump's speech these metrics are 70.45% positives and 29.55% negatives. These metrics can be found in the image below.
Topic Model
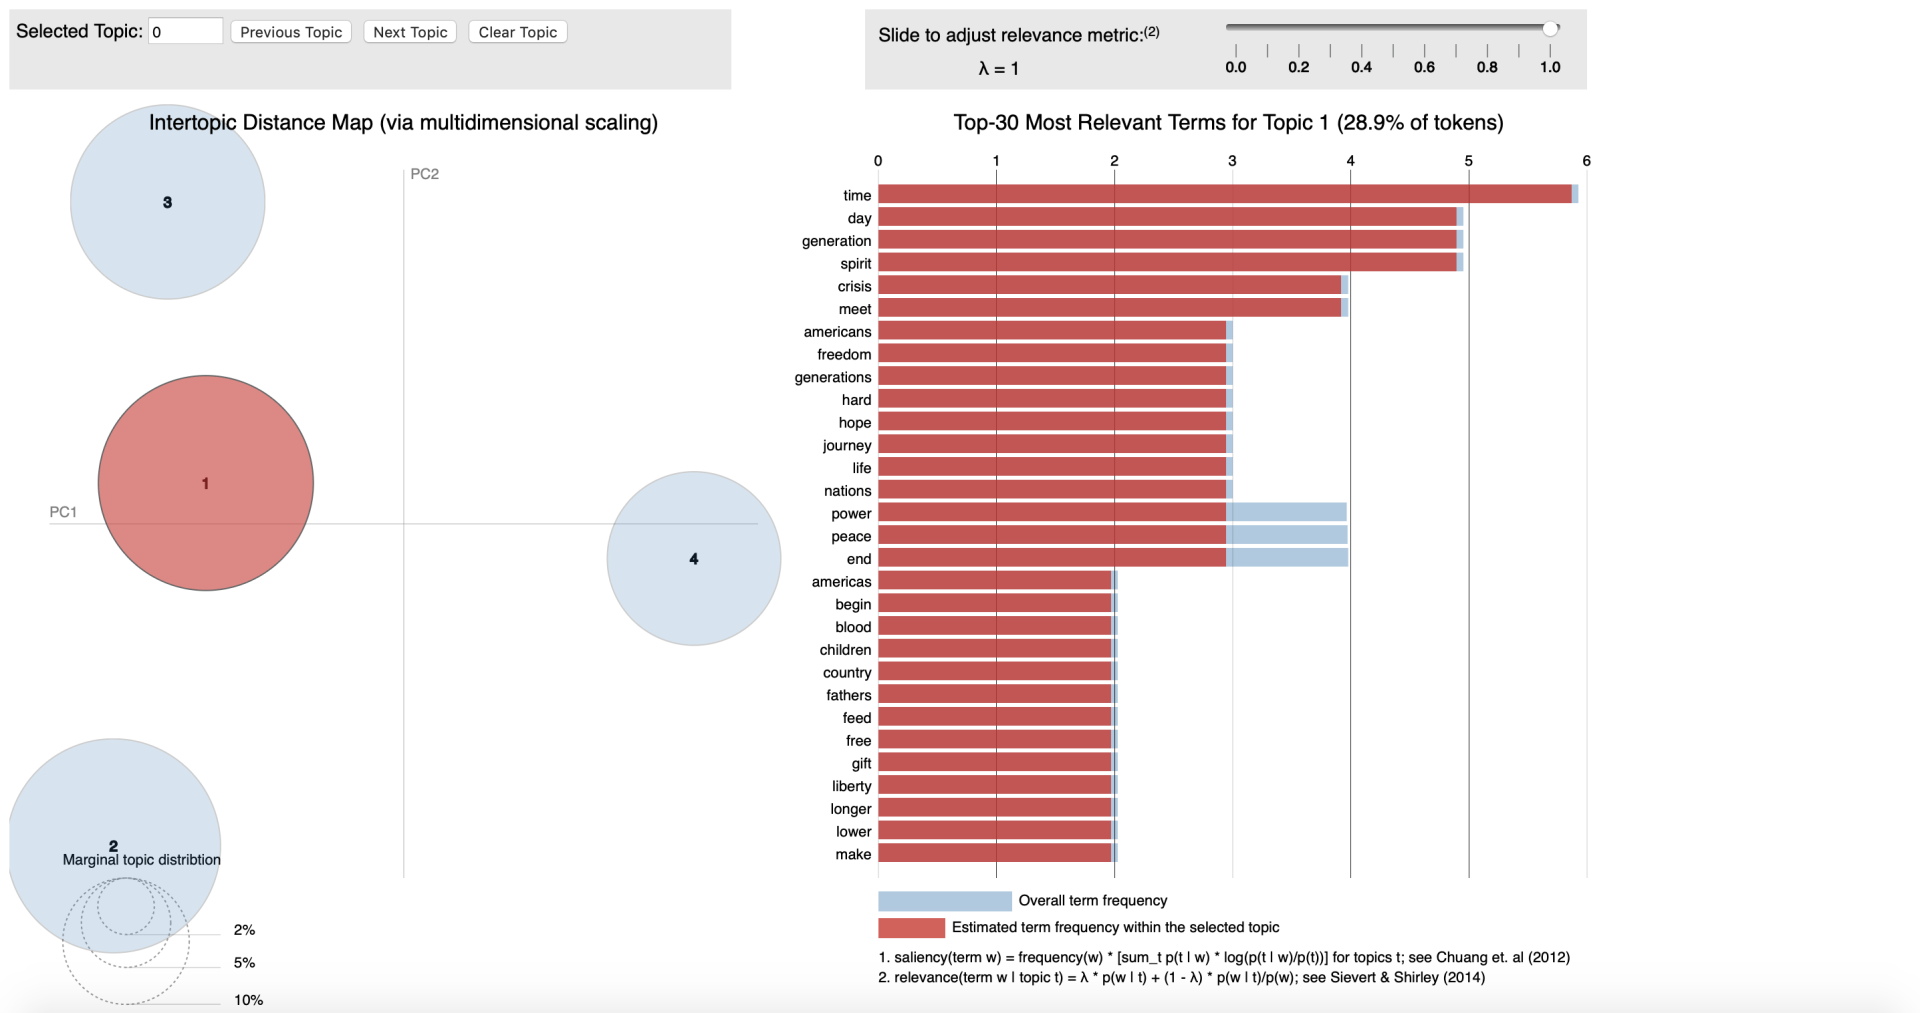
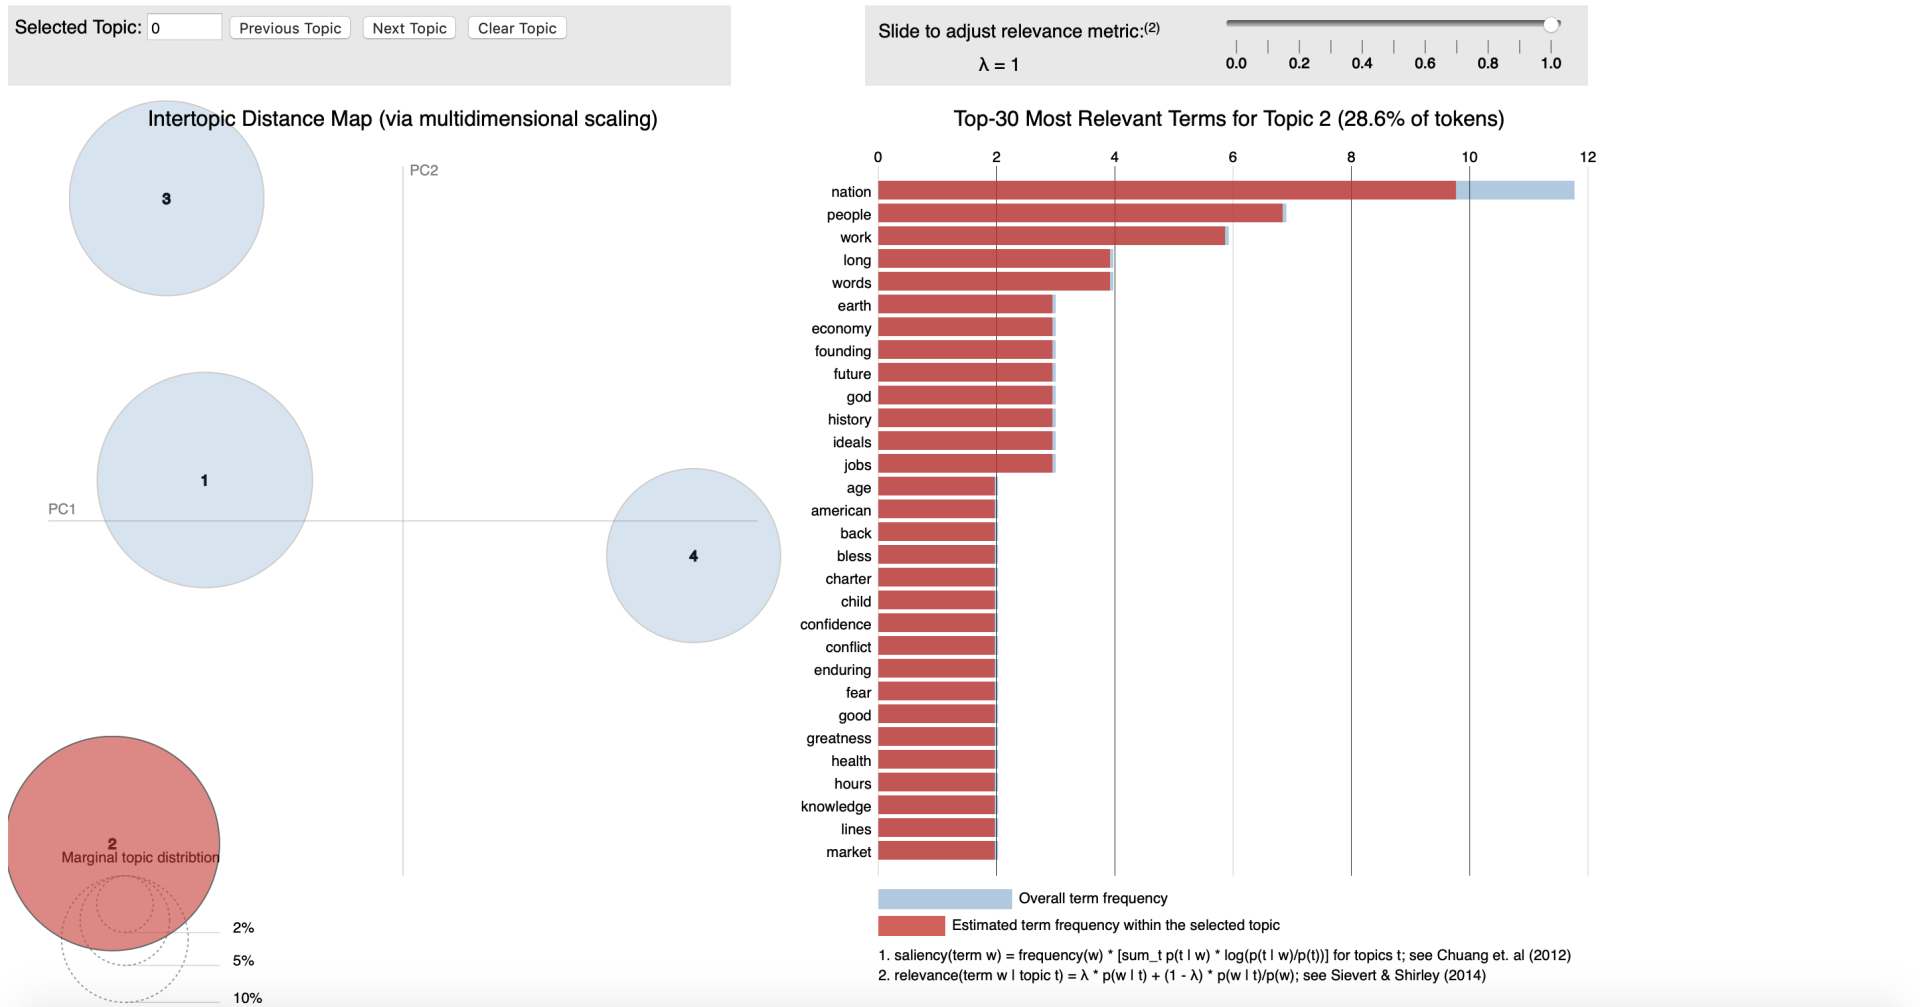
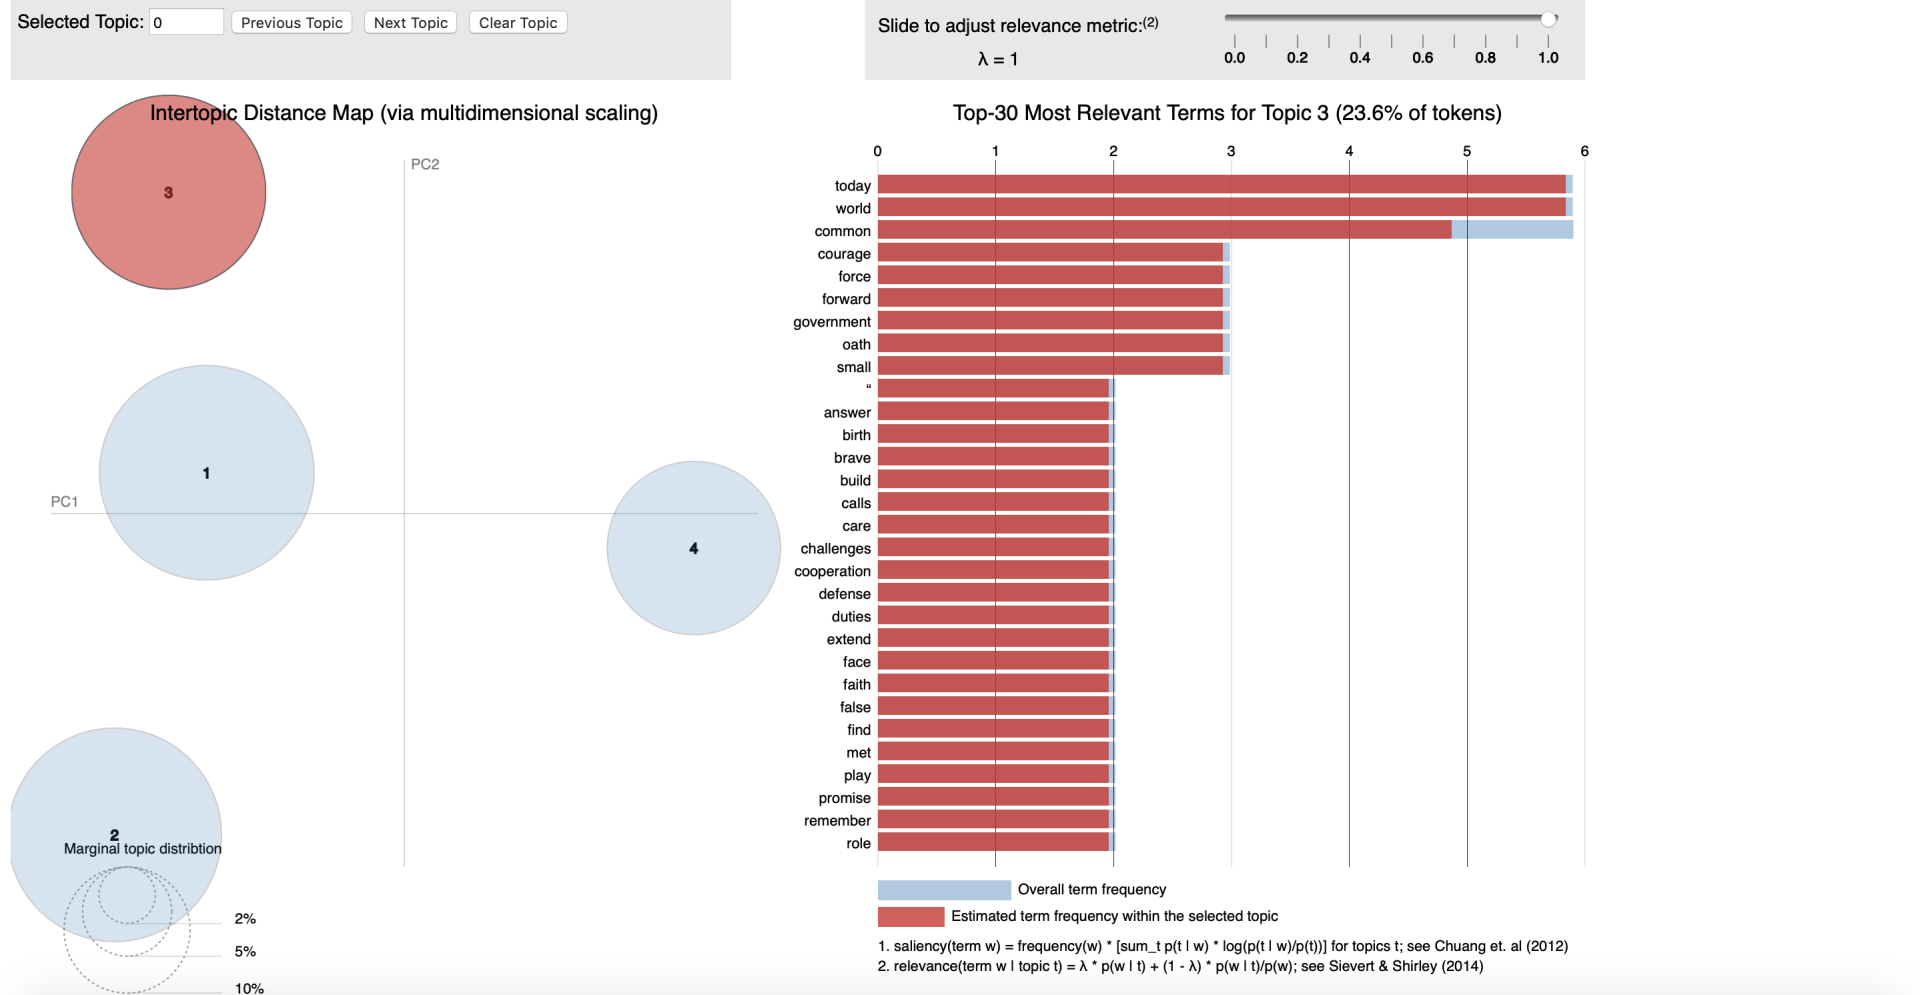
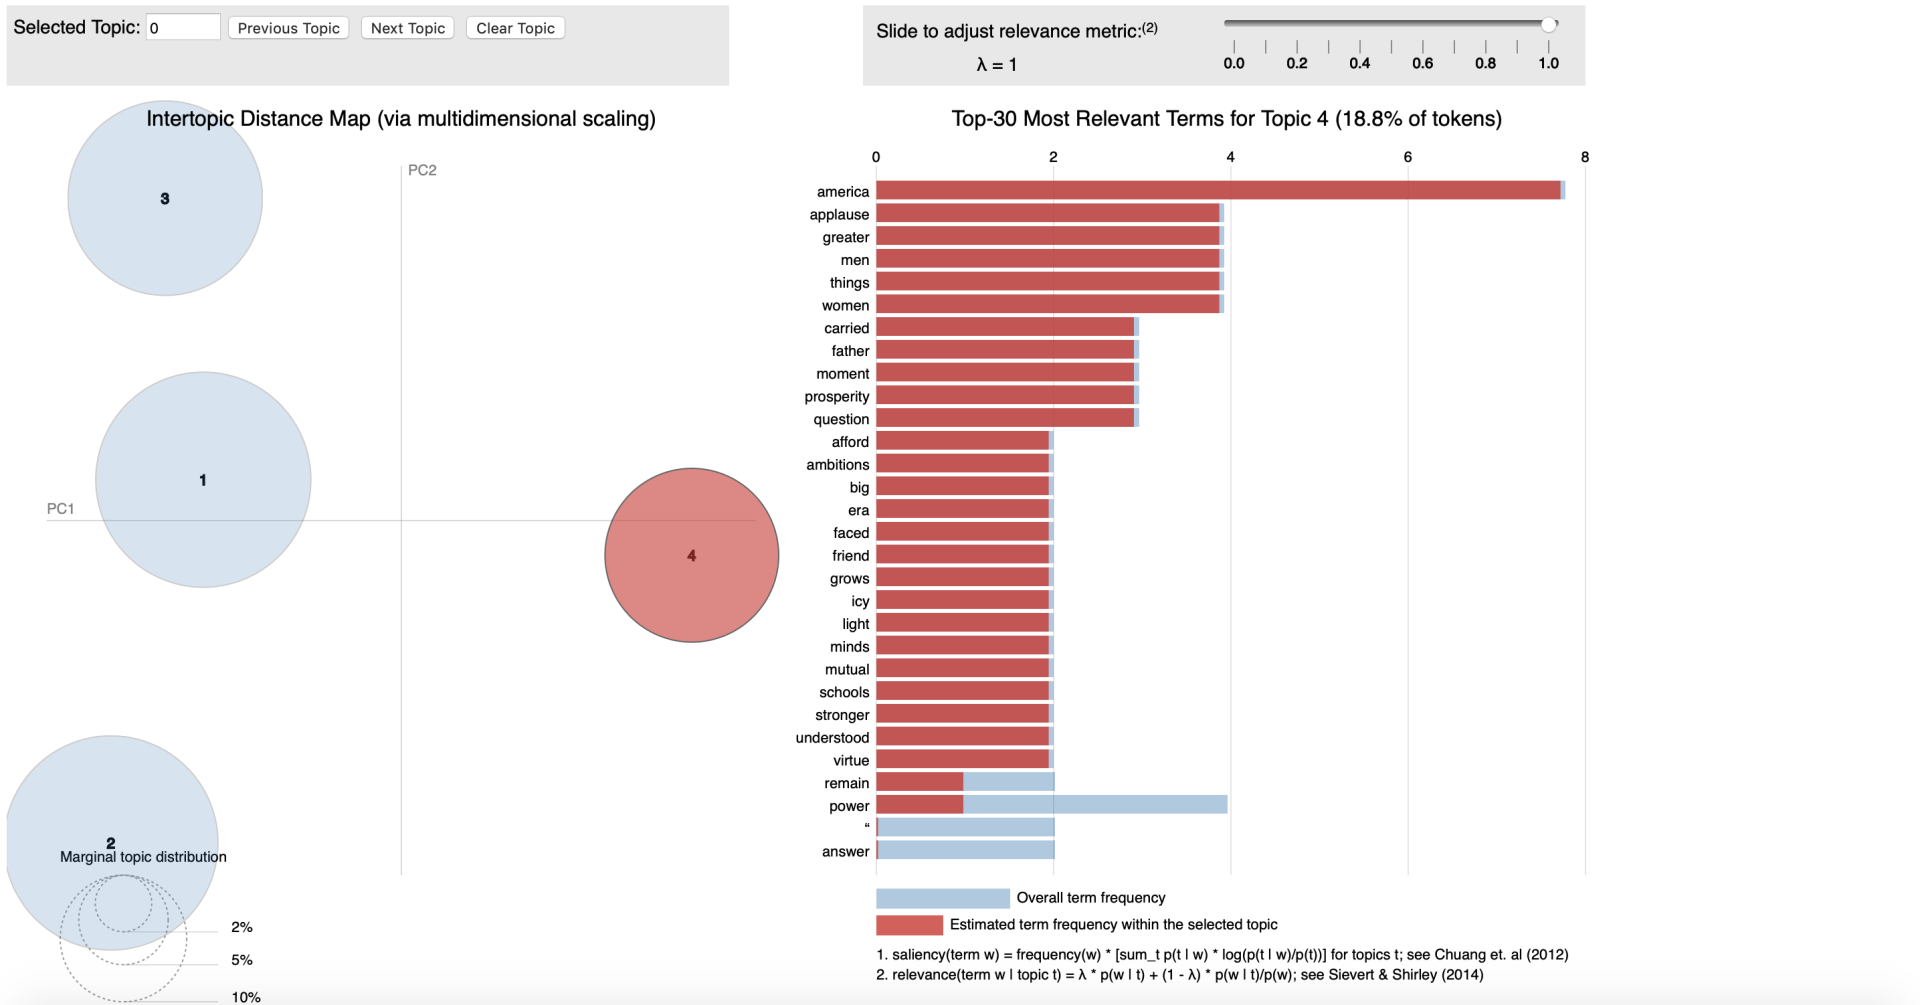
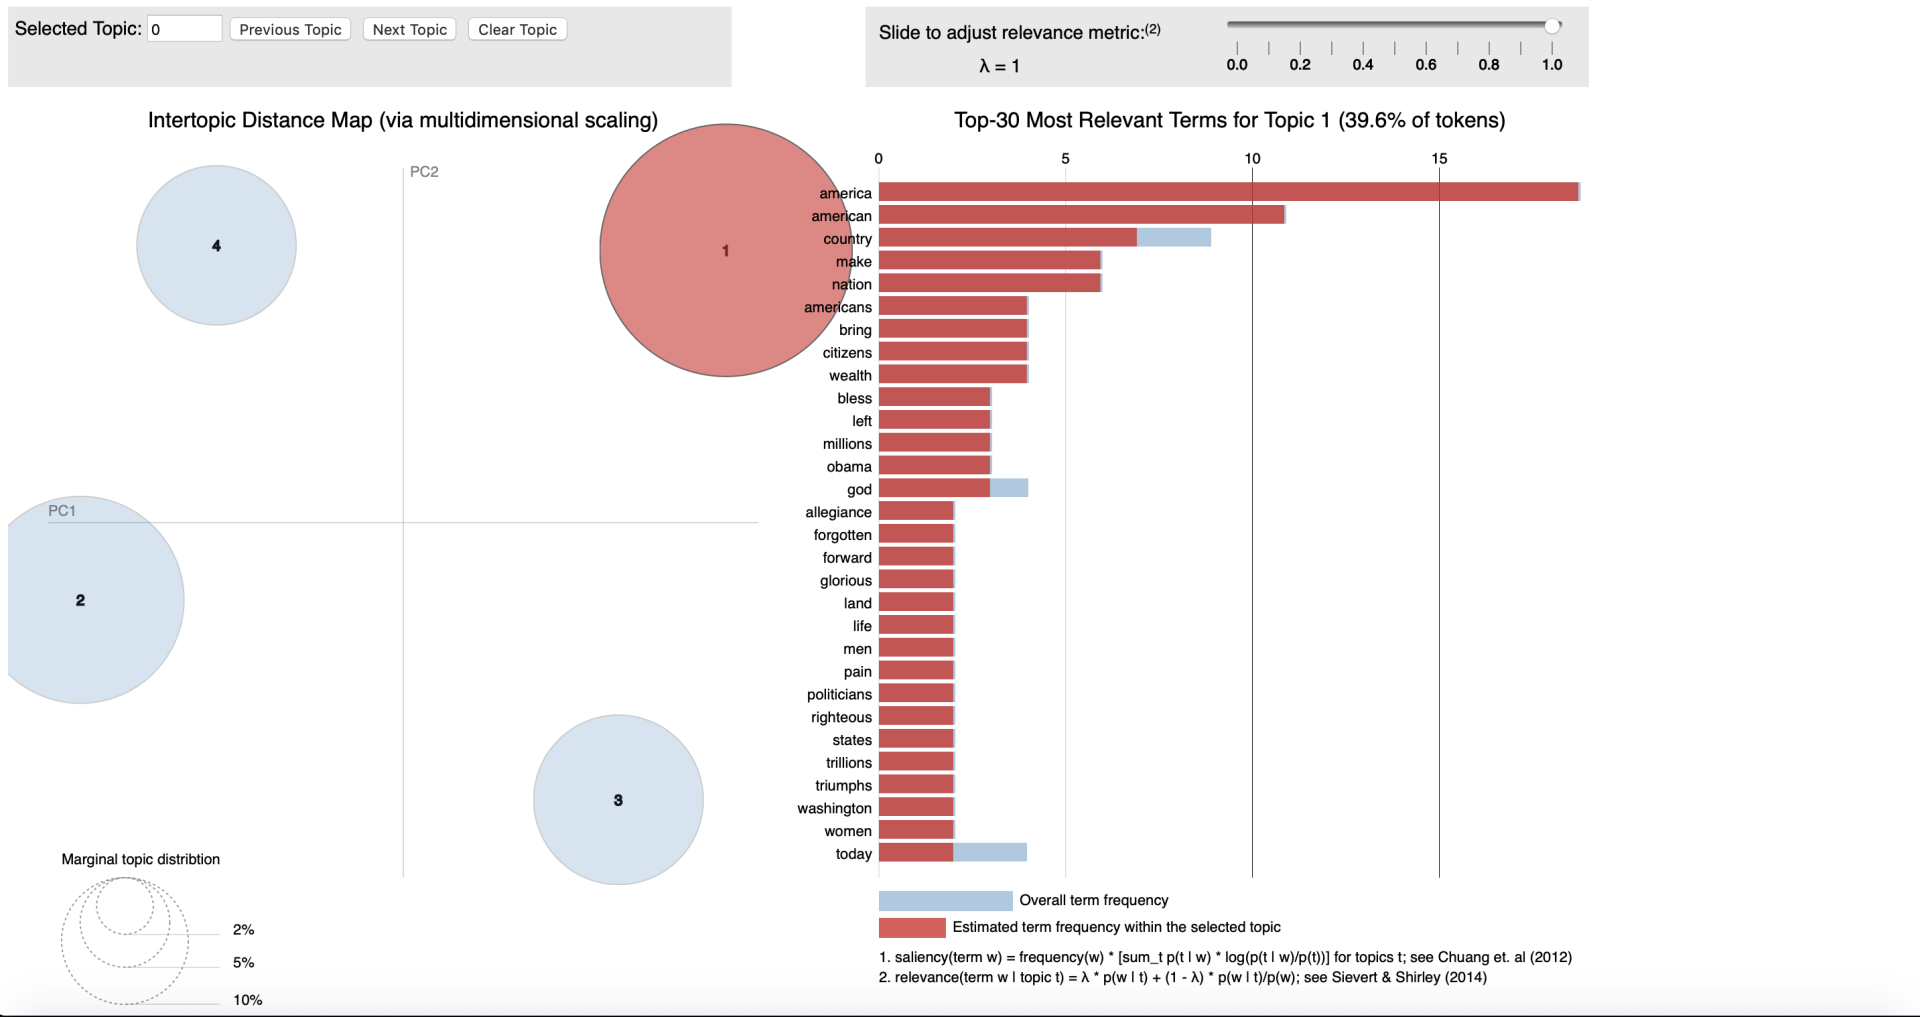
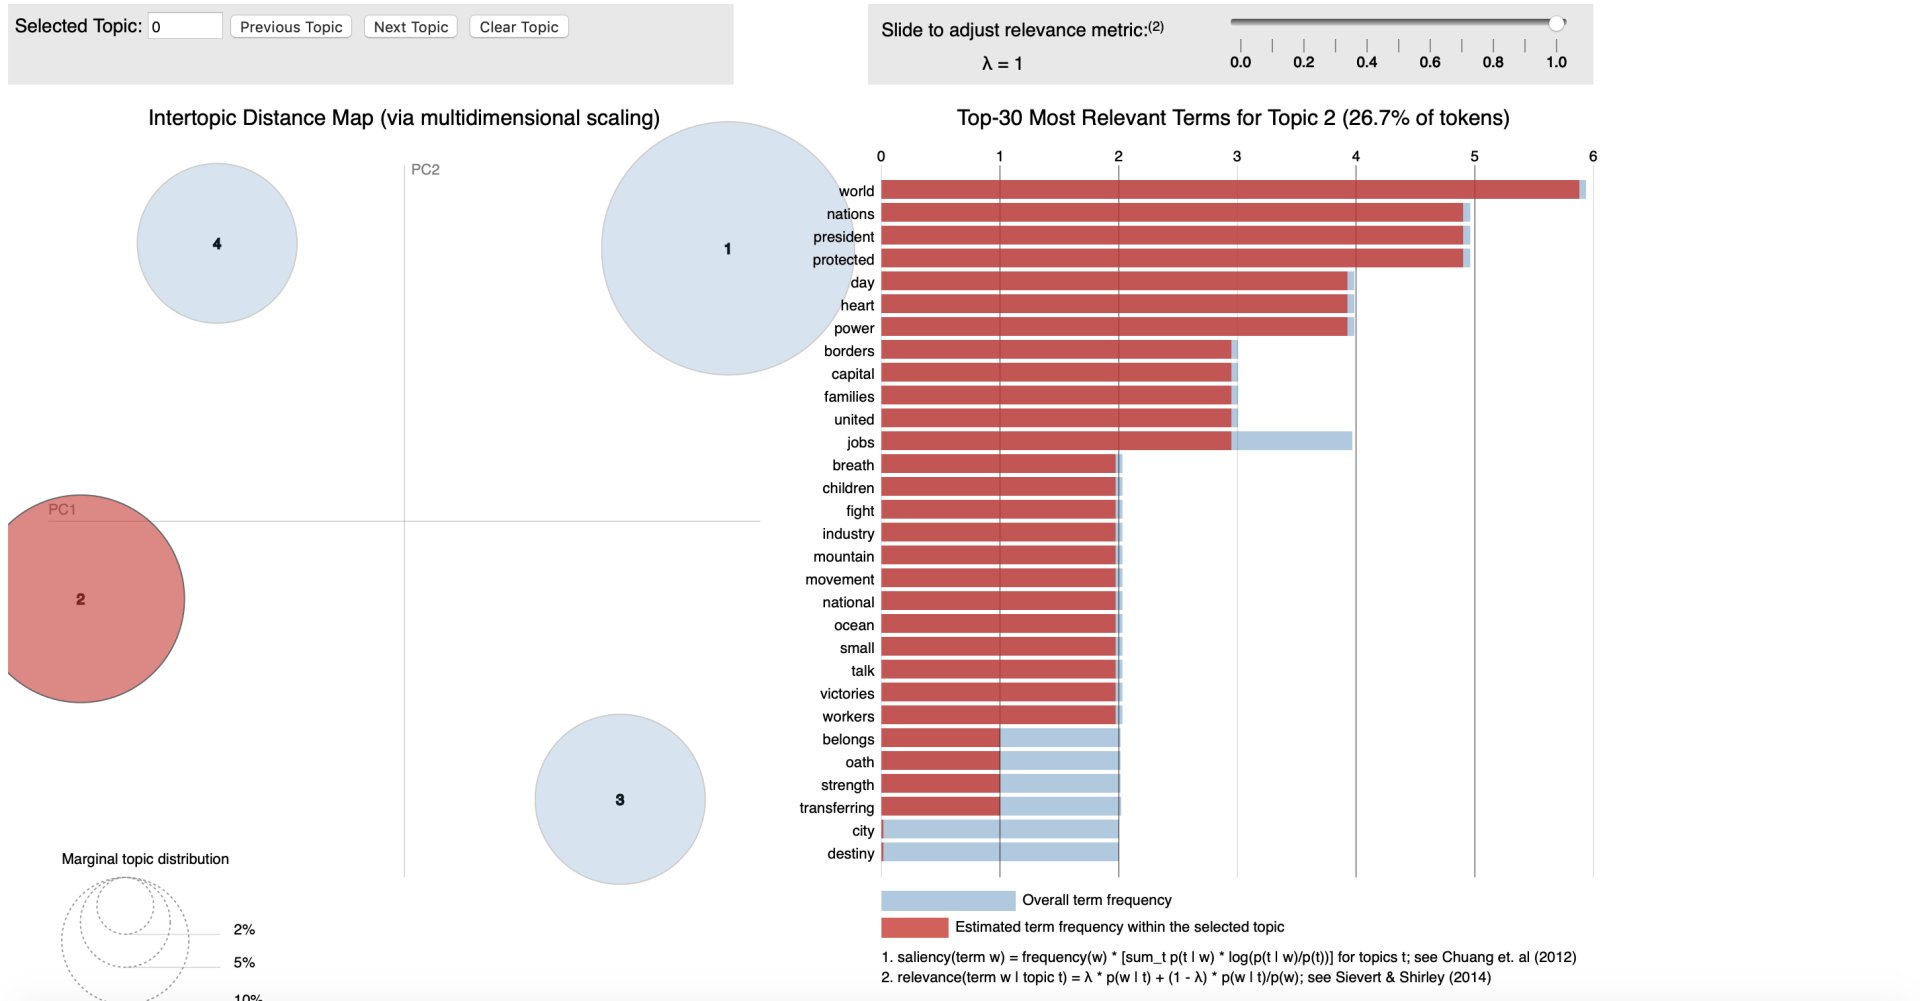
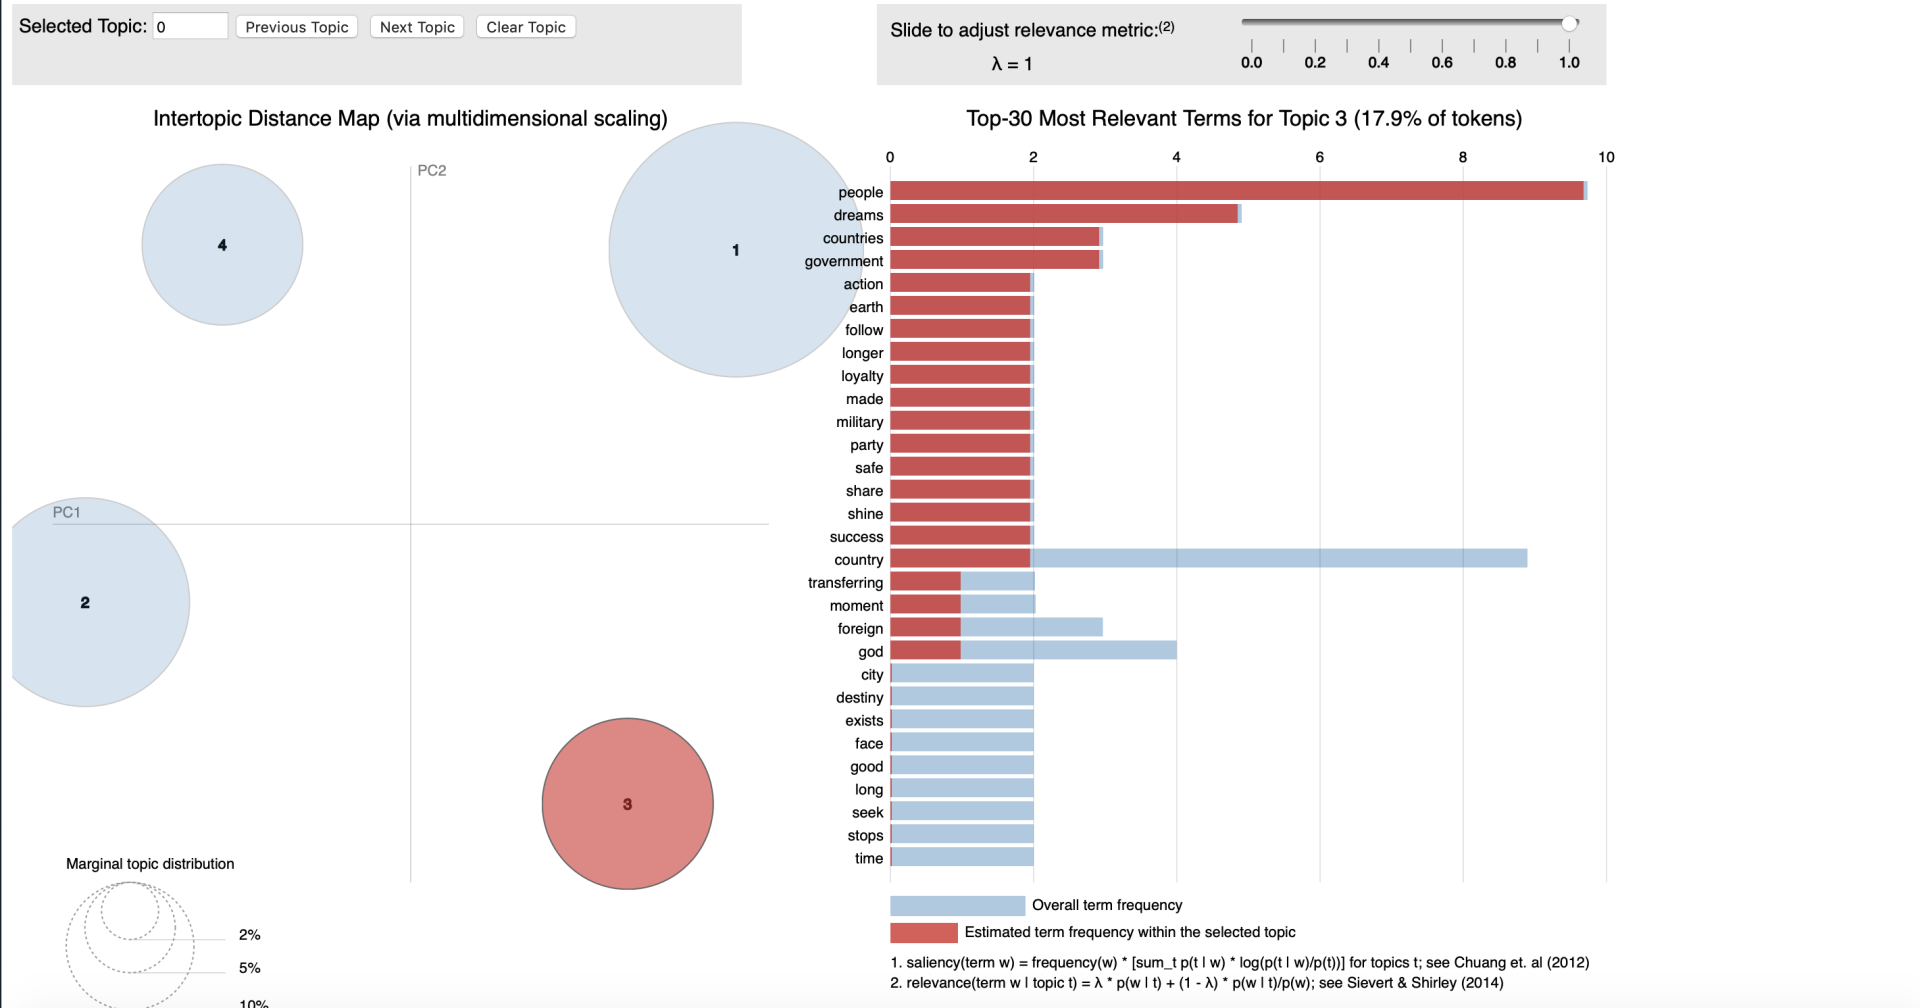
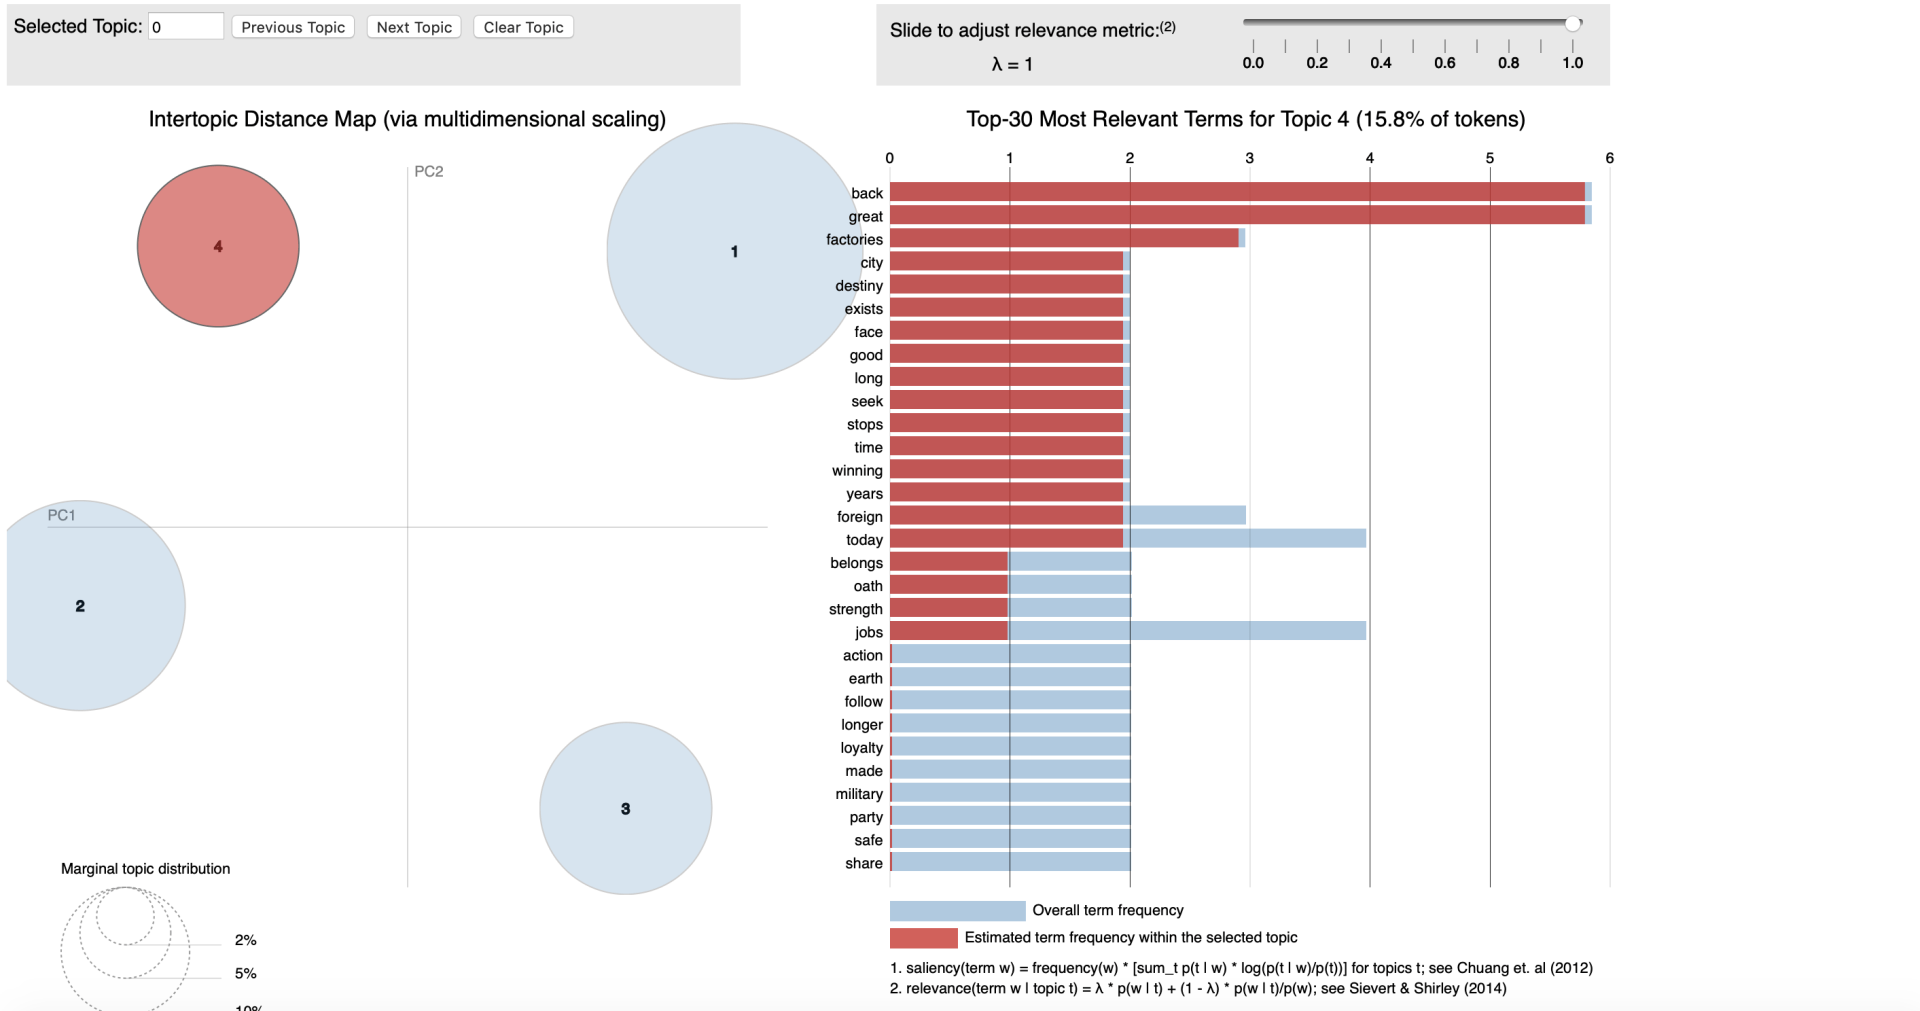
In the final part of this analysis we will try and create a topic models for both speeches. We do need to take in account that based on the relative low frequency of used tokens, this may impact the reliability of the presented model. However, for a illustrating how to work with a package called LDAvis by Sievert and Shirley (2015) ank it's output the outcome is  presented below. 

The actual output from the model is an interactive, where users can hover-over clusters as the map will interactively change. In terms of which tokens belong to a certain cluster. 

Keeping in mind that tokens are not used very frequent and a single speech might not consist of many topics. I set the model to identify four clusters per speaker. 

The great part of the visualisation is that based on principal component analysis that creates components on mathematical distances, these differences between clusters (across the components) are visualised. Meaning that a greater functional and logical difference in meaning is presumable  as clusters are further a way from each other on the plot. If cluster on the other hand are overlapping or close to each other, this may imply that those elements can be placed into one cluster. 

Have a look at the images below, and see if you are able to identify defferent topics both speakers talk about. (I will wisely stay away from this interpretation)
Topics Obama
Now let's investigate the results for the speech of Obama.
Topics Trump
Now lets see what the results for the speech of Trump give us in 4 different clusters
Conclusion
In this research we investigated the following research question:

How do the inauguration speeches of Barak Obama and Donald Trump differ?

In the first part of our analysis we investigated both speeches based on the different words that were used in each speech. Here we found that there is common ground between the speeches and some speaker specific token (word) usage. Implying that we are able to find some form of communality vs. idiolects.  

In the second part of the research we had a closer look at the common ground of both speeches and investigate the 'power' of this differences. E.g. if one speaker is more vocal than the other in the common tokens (words) they use? The results imply that for the tokens used by President Trump, he is more vocal, by repetition of these words. 

In the third part we investigated sentiments of the different speeches with the use of the Bing lexicon. Here we calculated word/sentiment scores for each speech based on the perceived sentiment of the word and how many times it is used. The results showed that Trump's speech consists of more positive elements that negative and shows slightly more intensity of those positive elements. Where Obama's speech shows more balance in the use of positive and negative evaluated tokens. With, however an outlier in negatively ranked token and the amount of times it is used in the speech. We found the following percentages for Obama's speech: 44.13% positives and 55.87% negatives. For Trump's speech these metrics are 70.45% positives and 29.55% negatives. 

Finally in the fourth section we created topicmodels for each speech based on the LDA algorithm. For each speaker 4 clusters were identified. However due to relative low frequency of words (tokens) and the fact that the speeches are (relatively) short the statistical support for those clusters is low. Implying we would need more speeches to identify the patterns (clusters) of speakers. 

The findings of the research may suggest that in some sense Donald Trump seems to articulate positively perceived words (tokens) more in comparison to Barack Obama where a more balanced distribution is visble in terms of the relation between positive and native perceived words (tokens).
Future research
This research gave us insights in how speakers differ in use of tokens (words). This was done in the context of two inauguration speeches. For future research it is suggested to add more speeches to the model and investigate if predicting token use is statistically possible. Hence we can start the ground work to build and train a model to detect: speech recognition (pun intended).

Hopefully I got you enthusiastic about the possibilities speech analysis has to offer!
Hope you enjoyed reading! 

All the best,

Ditty

Ditty Menon, The Data Artists, Ditty

About the Author: Ditty Menon

Founder of The Data Artists, The Data Artists Music and Nederland Wordt Duurzaam


Erasmus University Rotterdam Alumni with 12 years of experience in Data Science / Analytics / Digital. Passionate about incorparating data into all aspects of life & (more recent) using data for a sustainable world.


Radom facts:

Starts his day with a flat white or caffe latte and the financial times podcast.

Broke his glasses when walking into a lamppost while thinking of a coding issue

Loves Serendipity

Share by: