Blog_Corona_Comparing_Nations_pt2

CORONA - COMPARING NATIONS Pt 2

CORONA - COMPARING NATIONS PT2.
by Ditty April 2020
Keywords: Corana, COVID-19, Mortality Curve, Germany, Italy, The Netherlands and Spain
Recap - follow-up of previous posts.
In my first (introduction) post about the COVID19 pandemic I presented a framework for how we can gradually increase knowledge about this phenomenon with the use of some key statistical (and data science) concepts. In the second post I tried to zoom in to how the virus spread in China with use of data made available by Johns Hopins University.  In the third post I had a closer look at how the spread developed between countries. 

To keep the posts more manageable (less long reads) I decided to spit up the pervious posts and this post. Where in the previous post we investigated differences between countries and will now investigate if there are statistical differences and check how strong these differences are. 

In this post I will pay less attention to data collection and transformation compared to the previous post. However to keep the context in place, you might come across parts that are in both post. 
Introduction - What is going on 
Since the Corona / COVID19 outbreak last December 2019 that started in Wuhan, China a lot has been written about the phenomenon and it was confirmed as pandemic by World Health Organization on the 11th of March 2020. According to Johns Hopkins University 184 (at the time of writing this post) countries have been affected by the virus and have registered cases of COVID19.  
Objective & Limitations - Keep it small gradually increase knowledge
Based on the large amount of data and information (news, blogs, socials or official government documents) that citizens are confronted with - I sometimes found it difficult to distinguish facts from opinions. Hence, I found myself analysing the Corona outbreak on a daily basis. Where I would try to fact-check statements of experts or politicians that I heard the day before on popular late night talk shows in the Netherlands. Like Jinek or Op1. All in order to try and make sense of the virus and the outbreak. 

From a statistical data science perspective pandemics are interesting subjects to study, as they cover a lot of key statistical concepts that we use in data science. E.g. distribution theories, significance levels , exponential growth etc. My objective in this series of posts is to try and balance a simplification of what is going on while also keeping it understandable for audiences that are less data-literate. Implying that is preferable to keep research questions small and by answering the individual questions per post - we are gradually building knowledge about the virus and it's outbreak and at the same time are aiming to help readers become more data-literate.  
Research Question - what to better understand
I noticed that with the spread intensifying a lot of attentions was given to the situation in Italy, as media portraid a morbid picture going on in Italian hospitals. Consequently a lot of people in other countries were concerned about the situation in The Netherlands and wether we were heading towards a similar situation as in Italy. At the same time a big increase was also noticeable in Spain, and while I was checking the numbers on a daily basis it struck me that compared to the size of the population Germany remained relatively low. Thus I wantend to look at the development of the spread in those specific countries.

For this series of posts I will be zooming in on the following research questions / topics: 
From observation, to research question and hypothesis.
In the previous post we investigated the differences between countries, concerning their mortality rates. The images below show some of the findings of our research and we then formulated a follow-up research question, in terms of testing the observed differences for statistical differences and their power. Summarising the following research question is formulated for this post : 

How did mortality rates statistically differ in Germany, Italy, The Netherlands and Spain during the first 14 days after the first reported mortality?

Recap - Previous Conclusion
In the previous post I tried to give more insights on how COVID19 related mortalities developed in Germany, Italy, The Netherlands and Spain. As dutch media was paying a lot of attention to the situation in Italy and people were worried that the Dutch situation would develop similarly to that of Italy. Hence Spain's situation was also discussed as it was also worrying. In contrast to developments in Germany. 

On the basis of our analysis we found support that the Dutch situation remains worrying when taken into account that the growth character seemed to show signs of linearity and not yet exponential. (with the limitation of a small amount of available data).For Spain the growth-type change occurred earlier than for Italy. For Italy this was around 28 days after the first COVID19 related mortality and for Spain this was around 12 days.

The noticeable difference between the county's time of the first registered COVID19 case and the related mortalities remains remarkable. This might give us hints towards how governmental policies differed in terms of their response towards the outbreak.. 
Tools and concepts to use
With the use of R (language and environment for statistical computing and graphics) I will be using data science concepts, techniques and methods like descriptive statistics, distribution theory normal distribution, box plots and multi-variate analysis. The objective is to statistically support claims about the differences between the number of COVID19 related deaths between countries.


Let's get staRted - Data collection & Manipulation
For this analysis I used the data obtained from Johns Hopkins University's Github a place where they provide daily files with various information, eg number of new cases, number of death related to COVID19 etc. This data also forms the basis of their well-know dashboard that a lot of media use as main source of information in their articles. 


Meta Data & Data Transformation, Feature Development
Before starting the analysis let's have a closer look at the data that is available. In the previous post we paid greater attention to the available data, how to perform data transformation ad develop additional metrics (feature development).

The figure below shows that on a daily level / per country and region we have the (1) cumulative confirmed cases, (2) cumulative confirmed cases and (3) cumulative recovered cases.
Analysis Set
Having performed the data transformation and developed new feature. For an explanation how this were performed the previous post provides an extensive explanation. Also on how data was validated with the use of the National Institute for Public Health and the Environment Ministry of Health, Welfare and Sport concerning first confirmed case and confirmed death  The following data is available for our analysis: 
  1. Province: province / subpart of country
  2. Country: country
  3. Data: data
  4. Cumulative confirmed: cases: total confirmed COVID-19 cases
  5. Cumulative confirmed: deaths: total confirmed COVID-19 related deaths
  6. Cumulative confirmed: recoveries: total confirmed COVID-19 recoveries
  7. New confirmed cases: new daily confirmed COVID-19 cases
  8. New confirmed deaths: new daily l confirmed COVID-19 related deaths
  9. New confirmed recoveries: new daily confirmed COVID-19 recoveries
  10. Rank: number of days past at moment of confirmed COVID-19 related death after first confirmed COVID-19 cases
Analysis 
In the introduction we saw the results from our previous analysis. Just for readability purposes the graphs are presented below.
In this graph below you see how the mortalities developed (mortality curve) .
What is striking is that there seems to be differences between countries in the days between the first registered case and the first mortality. Therefor it might be fruitful to add more detail to the graph above by creating a new graph that illustrates the mortality curves per country. It is noticeable that the curves for Italy and Spain seem to change character from linear growth towards exponential growth, there were the curve noticeably steepens.
Analysis of differences (variance)
Having reconstructed how mortality curves developed over different countries in this analysis we are keen to find out if these patterns statistically differ from each other. The practical implication here being, to support or reject claims that the intensity seen of the infection in Italy and other nations - The Netherlands are heading down that same path. 

From a function / research perspective we would like to compare group differences..Groups here being Germany, Italy, The Netherlands and Spain. From a statistical perspective when investigating different groups a closely linked concept is that of 'Analysis of Variance'. Hence, with statistical tests we are, by calculation able to determine if coincidence has played an important role in our observations or are able to support our claim that there is a statistical difference. 

Again keeping in mind my objective for all post to have a low required knowledge level of statistical and data science concepts, I will briefly try to explain and give a simplified explanations of some of the concepts that are important. 

By utilising these concepts in an easy to relate to situation like the Corona crises, we are gradually increasing knowledge on how Data Science is applied,  in order to support claims. 

However an important assumption in statistical modelling in the context of an extreme situation like a pandemic that there is full availability of information (The Signal and the Noise by Nate Silver, 2011) is of course not met, meaning that in this case the route and explaining the concepts is more important that the actual outcomes. It goes without saying that a 'Black Swan Event' ( Taleb, Nassim Nicholas,The Black Swan: the impact of the highly improbable, 2010) like a global pandemic is extremely complex to simplify with statistics. 

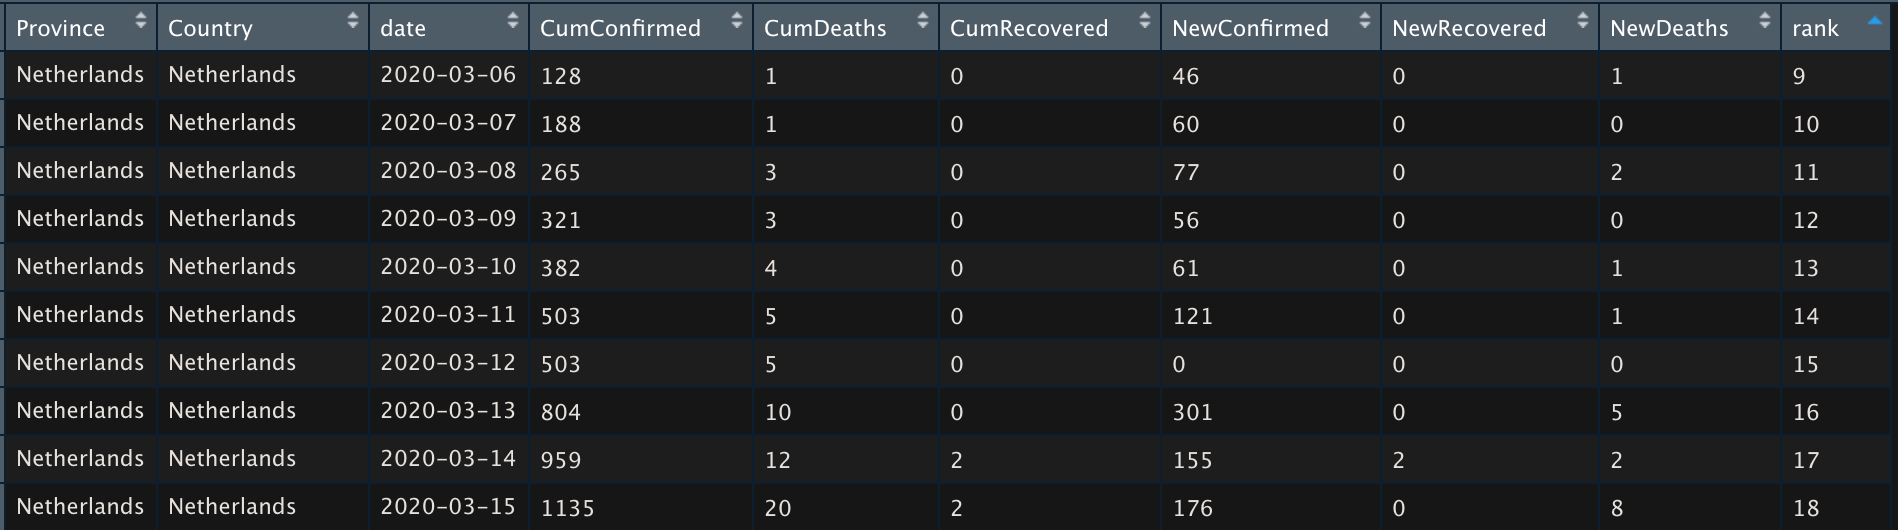
Managerial Implication 

Based on the assumptions that Data Science initiatives generally  develop according to analytical maturity frameworks - we are able to classify initivatives. (see table below)


This may help help in assesing your organisations analytical maturity. Where based on this assesment it is then possible to formulate an anlytical ambition and develop cooresponding roadmap(s) in order to achieve your ambition. 

Maturity Tier Artefacts
1 Rearview Mirror Standard Reporting Excel, Power BI, Tableau, Google Analytics etc
2 Rootcause Confidence Intervals , Cluster Analysis, Factor Analysis, Text Mining etc
3 Predict Regression Models, Random Forrest
4 Prescripts Neural Network, (Feed forward, Convolutional, Recurrent etc)
Synthesis of our current research objective and the presented framework above also suggests that for for leadership teams (managers or executives) a greater understanding is needed of specific key concepts in data science and their limitation. This will contribute to a better understanding of daily practices. E.g. (sales, visitors etc.) figures that differ in comparison to last year or last week, where (in the next growth phase of analytical maturity) you will be able to evaluate the statistical power of that difference. 

How to get to that next level? What can help in assessing if the observed differences are caused by coincidence (less influenceable) or may be a result of our actions. (Where the last claim might be a bit tricky, as causality is something different that significant difference). An easy way of challenging your data science team, and believe me they will love you for it, is to ask them the following question: 

"....and is that difference significant compared to..., and how strong is the observed difference." 

Once you start asking these kind of questions you will also create better understanding for which purposes you would want to look at the difference in more depth as for weekly reporting of daily reporting (related to level one: rear view mirror) this may be less relevant. Where for strategy related topics you might want more statistical support for choices.

To strengthen your improved line of questioning the I found Signal and the Noise: the Art and Science of Prediction b y Nate Silver (2011) particularly helpful in making sense of predictions (understanding and evaluating). Below you will find a video where the Swedish Investor gives an overview of key take-aways. And for those interested learning more about black  Taleb, Nassim Nicholas,The Black Swan: the impact of the highly improbable, 2010 the following video mighty be helpful.
For those interested learning more about The Black Swan: the impact of the highly improbable by Taleb, Nassim Nicholas, the following video by the Swedish Investor mighty be helpful.
Analysis of Variance
When performing analysis of variances between groups, different statistical tests can be used, where different tests have different assumptions for the underlying data; like expected distribution etc. In their paper "Comparing groups for statistical differences: how to choose the right statistical test, 2010, Journal Volume 20 February, Issue 1by Marius Marusteri and Vladimir Bacarea present an extensive overview  of factors to be taken into account for appropriate method selection.

To visually inspect the outcome of performed tests, bloxplots are very insightful. As they elegantly (sorry my opinion) provide us with a lot of information about the groups, as it summarises the data, shows the shape of the distribution, its central value, and variability. The box plot consists of the following elements. 

Minimum
the smallest value in the data set of each group. The minimum is shown under each "box" at the beginning of it's  “(bottom)whisker.”

Quartile 1
there where the "boxes" start. (75% of observations lay below this point)

Median: 
the line in the center of  each "box" . (50% of observations lay below this point, 50% above)

Quartile 1
there where the "boxes" end (75% of observations lay below this point)

Maximum
the largest value in the data set of each group.The minimum is shown above each "box" at the end of it's "(top) whisker.”

Outliers
points outside each "box" 
Boxplots
The image below represents the outcome of our test. Where we tested if there are significant differences between mortality figures in the first fourteen days after the first registered COVID19 death in each country. As can be seen in the graph the test for significant difference in the entire group is not significant (p=0.22). When further investigation differences between countries we find that differences are not statistically significant. (in the graph indicated by *ns under the "comparison lines".

Concluding that there is no statistical evidence that supports the claim that there are nation differences in observed mortalities in the first days after the first registered mortality case of each country. Implying that concerns of similarities in the patters of Italy might be grounded. We found that the beginning of each national curve are similar. 

It may provide hope that this simplification of the reality does not take into account more that fourteen days after the first registered mortality, in order to keep groups comparable. A practical implication may be that other countries have observed and learnt from the Italian situation and responded in a different manner, which could help prevent theincrease in skewness of Italian mortalities (Hockeystick effect), and thus respond by measures to 'flatten the curve'.
Future Research
In this analysis we merely looked at the Mortality Curves of different countries in absolute vales. For future research it might be interesting to compare development with more data. In particular after 14 days of the first registered mortality as this can provide valuable information to what extent different national measures impact mortality rates. 
Concluding remarks - not an epidemiologists
Please note that I am not an epidemiologists and thus wary of relating the outcomes of my endeavours to the current situation. My aim is to create a better understanding about the virus and it's outbreak and hopefully help people (and myself) to place presented information in a more statistical perspective. 

Please also note that this post has not been peer-reviewed. The sole purpose of my endeavours is to present insights into the outbreak and how - with relative limited coding in R - it is possible to dive into the data yourself. Hopefully get you enthusiastic about the possibilities data science provides.
Hope you enjoyed reading! 

All the best,

Ditty

Ditty Menon, The Data Artists, Ditty

About the Author: Ditty Menon

Founder of The Data Artists, The Data Artists Music and Nederland Wordt Duurzaam


Erasmus University Rotterdam Alumni with 12 years of experience in Data Science / Analytics / Digital. Passionate about incorparating data into all aspects of life & (more recent) using data for a sustainable world.


Radom facts:

Starts his day with a flat white or caffe latte and the financial times podcast.

Broke his glasses when walking into a lamppost while thinking of a coding issue

Loves Serendipity

Share by: