Blog_Spotify_Song_Recommendation

SPOTIFY - SONG RECOMMENDATION

SPOTIFY - SONG RECOMMENDATION
by Ditty Oct 2018
Keywords: Machine Learning, Spotify, API handling, Recommendation Engine, Random Forrest
Introduction - What is going on 
This research is a follow-up to our previous research, where we introduced working with the Spotify API, to analyse different features that are available in the API. Here we related available features to associated emotions of songs (Emotional Quadrants), and this gave us an idea how (my) musical preferences is constructed. Furthermore we presented enhanced features for future analysis.

In this research I want to take it one step further and see if machine learning can help in predicting my preference.

For the readers of the previous post, for readability and providing context there is some duplication between both posts. 
Objective & Limitations
In the past already when evaluating streams of my debut album: Somewhere in Between I worked with some regression algorithms to identify opportunities for future musical releases on The Data Artists Music label. This lead to some investing insights, however scored less on predictablility. This research can be seen as my second attempt to statistically model Spotify data. Only this time with the objective to model my musical preference. In general this is the similar approach Spotify would use for instance for their 'daily' suggestions or album suggestions in the Spotify App.
Research Question - what to better understand
For this research the following research questions were formulated
Main Research Question:
What are the possibilities to model (my) musical preference based on Spotify API ?
In our previous post we gave an extensive overview of what data is available in Spotify' API and how we extracted it with the use of the R package SpotifyR.

With the use of R (language and environment for statistical computing and graphics) I will be using data science technique and methods like descriptive statistics, machine learning, regression and API handling. The insights can be used to contribute to a better understanding of musical preference and the underlying constructs of the music that preference is built on. 
Let's get staRted - Data collection & Manipulation
As mentioned the main research data consists of modelling my musical preference with the use of Spotify data. For connecting with the Spotify API we will use the SpotifyR library by Thompson, Parry and Wolf (2017) in R. A great introduction for using this library is given by Mia Smith in 'What is Speechiness' (2018). 

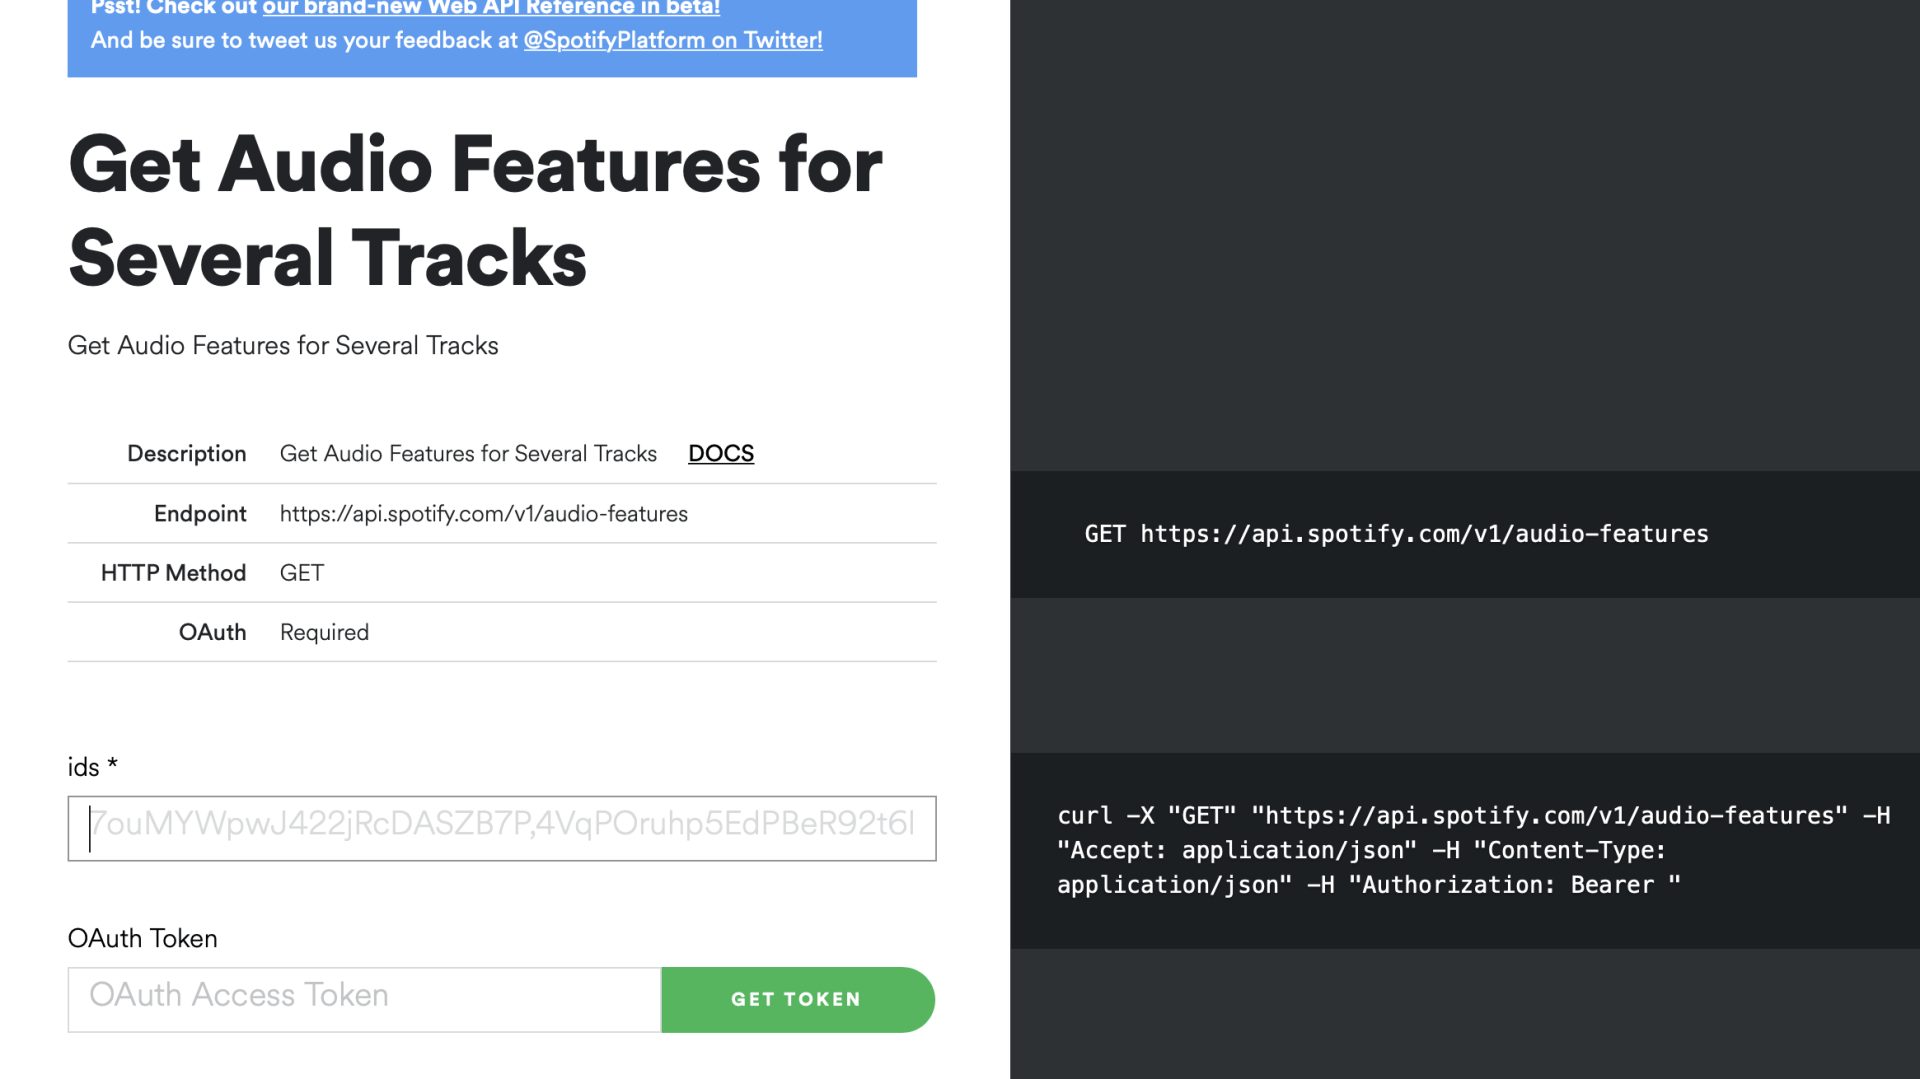
With the use of the SpotifyR wrapper is relatively easy to extract artist, album and song information from the Spotify API. The API documentation from Spotify is available at the Spotify for developers page. There you can also use the console section if you want to (manually) query the API. Note that here you also need to register your app to receive an access token. You will need that token for every query. Below you can find an example of the Spotify API console. Where you can manually enter search fields and the response is given back in de console.

 In my previous post I also shorty describe what an API is. 
Let's get staRted - Data collection & Manipulation
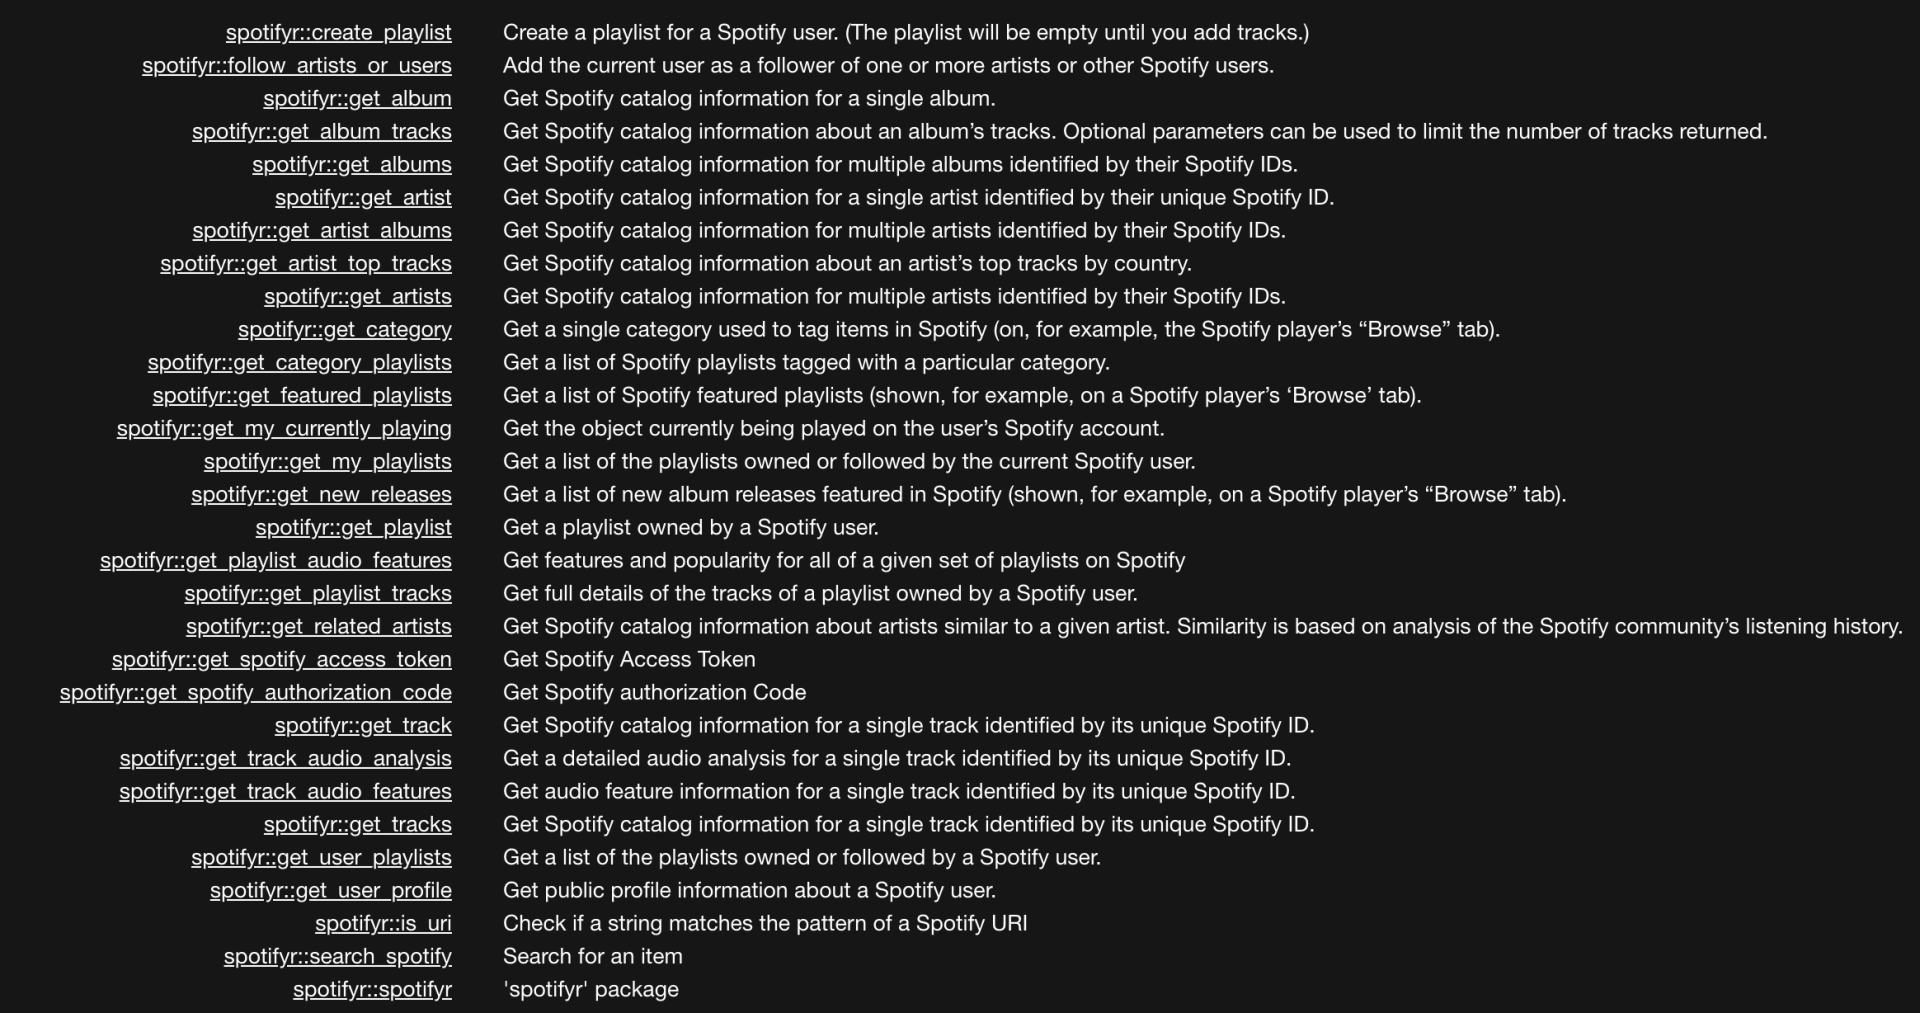
The SpotifyR library in combination with the Spotify API allows you to go through the (meta) data in a fairly straightforward manner. The image below gives you an idea of what of the possibilities are and which functions are available in the package. The overview is directly printed as part of the package from my R console. Here you can see that there are functions to call for album characteristics, artists etc.
Random sample: from album to artists and number of liked songs
As mentioned in the introduction the challenge consisted of naming 20 albums. For this research we are due to time constraints making the assumption that the liked albums can be transfer to all the songs on that album. Hence, we are able to create a big analysis set. Without going to each individual song and manually classifying it as 'like' or 'dislike'. 

Below, you can find the playlists of my liked and dislikes songs.
Feature Analysis: what data is available in the Spotify API.
After setting up the Spotify API link  and going through the functions of the SpotifyR wrapper, we need to have a better understanding on what data (features) are available in the API. A simplified representation of the Spotify API is given below, here we see that we can retrieve data on the following "subject areas". (As distilled from Spotify API Console).
  • Albums
  • Artists
  • Browse
  • Episodes
  • Follow
  • Library
  • Personalisation
  • Player
  • Playlists
  • Search
  • Tracks
  • Shows
  • Users Profile
Relavant Areas
For this research we will be looking at combining data from the following three subject areas, as we  want to investigate individual songs, the album they below to and by which artists they were written. 

  1. Albums
  2. Artists
  3. Tracks
Analysis Set
We will be comparing two data sets:
  1. Liked: 2.155
  2. Disliked: 2.466
After going trough the API documentation, our analysis set consists of the following features.
  1. artist_name: artists of song
  2. track_name: track/song
  3. target: liked or disliked 
  4. danceability: between 0-1. the higher the value related to danceable a song is
  5. energy: between 0-1. the higher the value related to more energy of the song
  6. loudness: between 0-1. the higher the value related the louder a song is    
  7. speechiness: between 0-1. the higher the value related more vocality in a song  
  8. acousticness: between 0-1. the higher the value related more acoustics in a song  
  9. instrumentalness: between 0-1. the higher the value related more instruments in a song  
  10. liveness: 0-1. the higher the value related more liveliness in a song           
  11. valence: 0-1. the higher the value related more positivity in a song 
  12. tempo: tempo of a song in beats per minute
  13. duration_ms :duration of a song in milliseconds
  14. release_year: year that song was released
  15. key_mode: Main musical key of song (A, B#, C etc.)             
Analysis 
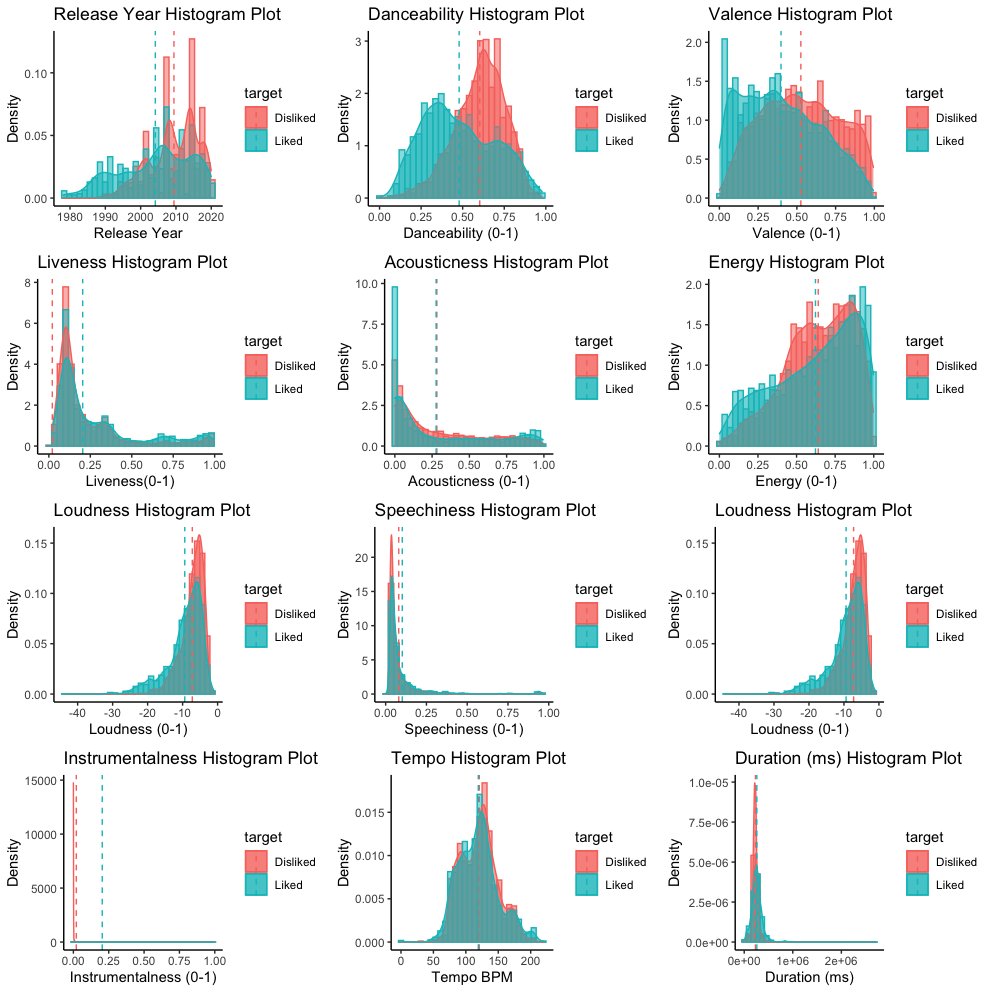
First let's have a preliminary investigating of the separate features and their distribution in our analysis set. Note that we use density plots.

Where density is proportional to the chance that any value in the analysis set is equal to that value. The density is calculated from the counts, meaning that the difference between a traditional histogram with frequencies and one with densities, is the scale of the y-axix  (de Vries, Meys 2008)
From the image above you can clearly see that on some features there are differences between the songs I like and the songs I dislike. The features being: (1) Release Year, (2)Danceability, (3)Valence, (4) Valence, (5)Liveliness. It seem I like releases more, that are somewhat older,  prefer songs that are more lively and enjoy less joyful songs (valence). Intuitively this makes sense.
Train and Test Set
When building a machine learning model. It is important to split our data set into 2 sets. Namely a train set and a test set. The rational behind that is that we want our machine/algorithm to identify important features that predict our outcome from our train set. So that in a later stage we can use to findings on our test set, in order to see if the algorithm also performs good on that second (test) test. 

If we would not create two set, we run the risk that our model would be accurate on making predictions on our data set, but when we would then feed it new data run the risk that the algorithm performs less in predicting accurate outcomes. This phenomenon is related to overfitting.

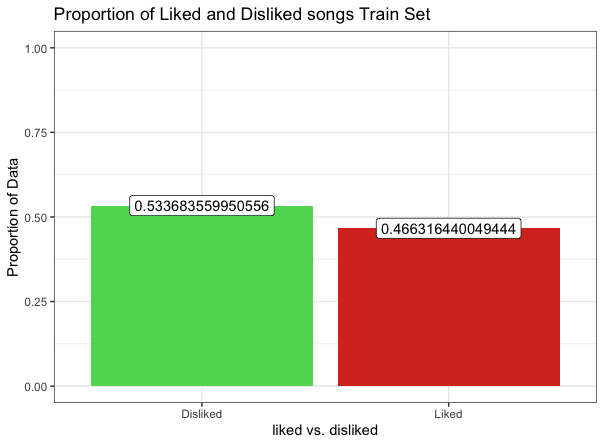
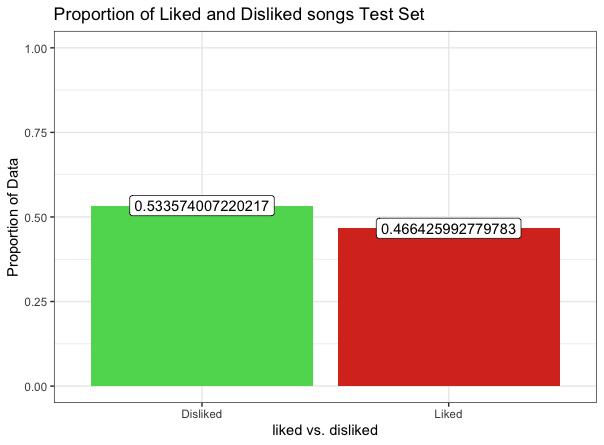
The plots below show that the proportion of Liked vs Disliked Spotify data is 0.56 and 0.46, in both the train and test set.
Classification model
We will create a classification model using random forest algoritm. Random forest is an ensemble-based algorithm built on the decision tree method and is also known for its versatility and performance. I’m going to go ahead now and create our Random Forest model, using a 5-Fold Cross Validation, with 3 repeats. The results are presented below
Model Evaluation
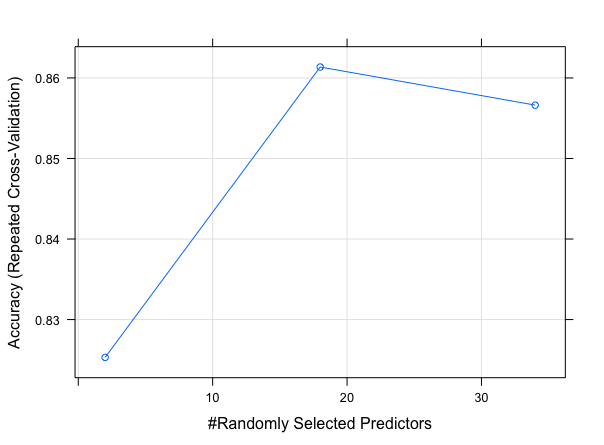
From the model results we can see that the model with mtry equal to 18 produces the highest accuracy which is 0.86 - where mtry is number of variables available for splitting at each tree node.

The plot below shows that adding more mtry does not result in better accuracy of the model. Implying that mtry equals 18 has the best performance.
Feature Importance
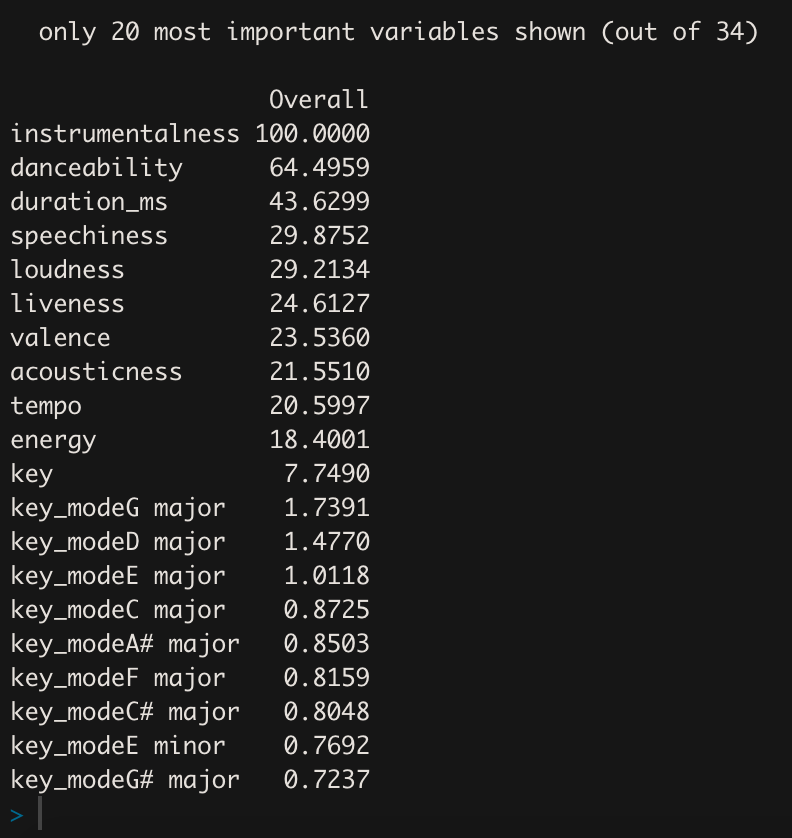
Now let's have a closer look at the features that are important in our model. For this model: instrumentalness is the most important feature.
Now that we know that instrumentalness is the most important feature let's see what the Spotify documentation says about this feature, to give it some context.

"Predicts whether a track contains no vocals. “Ooh” and “aah” sounds are treated as instrumental in this context. Rap or spoken word tracks are clearly “vocal”. The closer the instrumentalness value is to 1.0, the greater likelihood the track contains no vocal content. Values above 0.5 are intended to represent instrumental tracks, but confidence is higher as the value approaches 1.0." (Spotify API documentation)

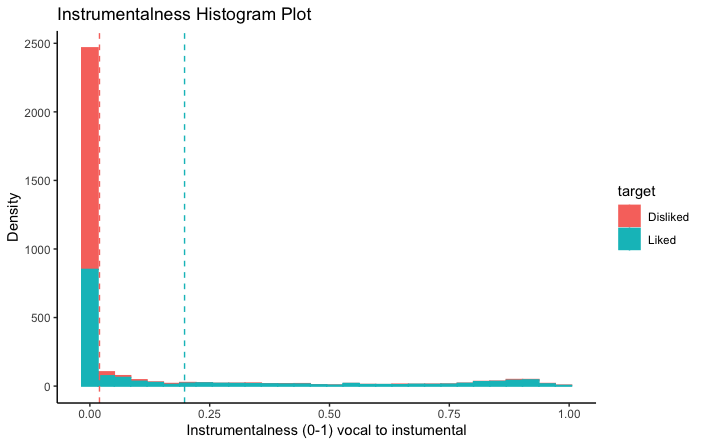
How did the distribution look for the liked and dislikes songs? In the figure below we can see that the liked  songs have a wider range than the disliked songs. Implying that the chance is bigger that I will like a song with less vocals (more instrumentalness).
Evaluation: Out-of-bag Estimates
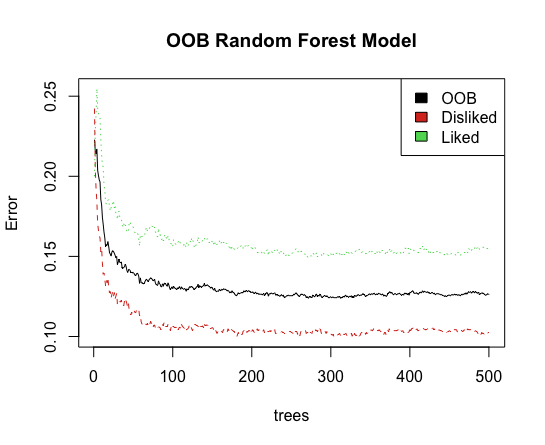
Random forest model produce a value called out-of-bag estimates (OOB) that can be used as a reliable estimate of its accuracy on unseen examples. from this plot it can be seen that Liked (green) error value is relatively higher than the Disliked (red).
Evaluation: Confusion Matrix
For the evaluation of the model we use the confusion matrix. A confusion matrix is a table that is used to analyse the performance of a classification model on a set of test data. Meaning that we check if the algorithm that we found in our training set also performs well on our test set. 

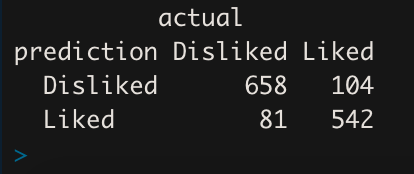
In the output below we  can identify the cases that were predicted correctly and the cases that were predicted incorrect.
The table above shows the confusion matrix. Here we see that

  • Out of the 739 (658+81) actual Disliked the model classified 658 songs correctly
  • Out of the 646 (104+542) actual Liked songs the model classified 542 songs  correctly 
Concluding that our model is 86% accurate! (1.200/1.385= 0.86)
Evaluation: AUC
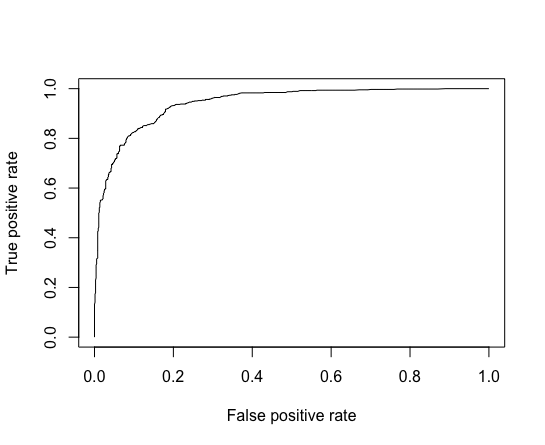
AUC values are obtained from the area under the ROC curve. ROC is a curve that shows the classification model performance in all thresholds. ROC has 2 axes

x : False Positive Rate (recall)
y : True Positive Rate (1 - specificitty)

AUC value of 0.94 indicates that the model successfully determined liked and disliked songs.
Conclusion
In this research we investigated the features that could predict Liking or Disliking a song. Based on features derived from the Spotify API and with a machine learning technique (Random Forrest) we we able to build a model that based on different parameters like OOB, Accuracy and AUC is able to predict fairly well. 

The most important predictor in our algorithm is  "instrumentalness", which relates to the amount of vocals vs instrumentalness of a song. We found that the more instrumental a song is, the greater the chance will be that I like it! 

So let't put this to one last test. What do you think how I would classify these two following songs:
Future research
In this research we only used one machine learning technique, namely Random Forrest,. For future research we might be able to improve model accuracy by adding and comparing different modelling techniques and comparing results. E.g. k-Nearest Neighbour or Logistic Regression. From a feature perspective it would be interesting to add subject related features into the analysis set, such as personality based features and personal preferences.The current model only incorporates song specific features.
Concluding remarks
With this research I hope to have made you enthusiastic about adding API's to your Data Science Toolkit. And in the process have simplified machine learnning for you. For me, as somewhat a dinosaur in the field - the endless possibilities in working with vasts amount of data never seems to stop an amaze me. 

At the same time I also see a managerial implication concerning the 'more or less data is better'. discussion. In my perspective this should alway be a balanced consideration, as data science initiatives can be fruitful, costly and fail miserably. In practice to manage the 'more or less data' discussion I look at goals of data science initiatives and the alignment with innovation horizons. Where different horizons (McKinsey’s Three Horizons of Growth Model) come with different levels of levels of experimentation room.

 In my research on the bushfires in Australia - you read more on this topic. (managerial implications section).
Hope you enjoyed reading! 

All the best,

Ditty

Ditty Menon, The Data Artists, Ditty

About the Author: Ditty Menon

Founder of The Data Artists, The Data Artists Music and Nederland Wordt Duurzaam


Erasmus University Rotterdam Alumni with 12 years of experience in Data Science / Analytics / Digital. Passionate about incorparating data into all aspects of life & (more recent) using data for a sustainable world.


Radom facts:

Starts his day with a flat white or caffe latte and the financial times podcast.

Broke his glasses when walking into a lamppost while thinking of a coding issue

Loves Serendipity
Share by: